Downside potential in NZD vs. CAD
Relative commodity price trends (stronger energy and weaker dairy) help account for some of the recent recovery in the AUD/NZD. Further supporting the recovery is the rise in global bond yields, tending to remove some of the additional demand for NZD generated by a global investor pre-occupation in a ‘search for yield’. There may be more upside for the AUD/NZD, but revisiting the fair-value models we introduced in August, suggests that it is not far from fair-value. Instead, we look at CAD/NZD. As a more pure energy play, CAD has an advantage of the AUD that may be dragged down by weaker steel prices in China since August. Furthermore, CAD is a much lower yielder than NZD or AUD, and thus is unlikely to need to reverse earlier gains related to a ‘search for yield’ as global bond yields rise. Our regression analysis suggests that NZD/CAD has not yet fallen by enough to account for either the diversion in oil from milk, or the rise in global bond yields. Furthermore, recent macroprudential measures in New Zealand appear to be working to slow its housing market and the RBNZ is likely, in our view, to proceed with a rate cut in November. The Canadian economy has been mixed lately, but fiscal expansion is likely to be felt more as the year progresses and recent data in the USA is somewhat more positive, suggesting potential upside revisions for the USA and Canadian economic outlooks.
Commodity price developments
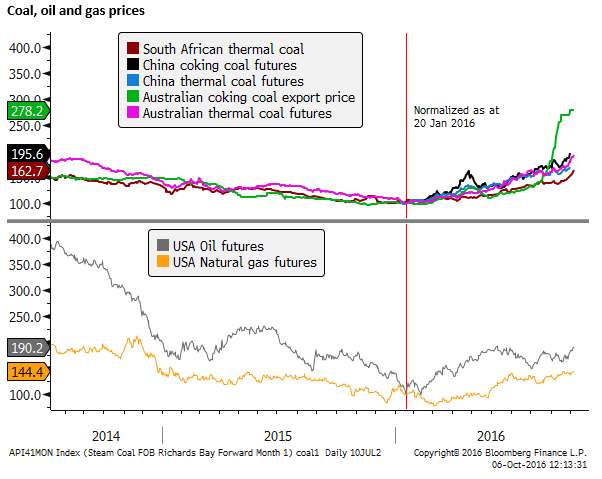
There have been some interesting divergences in commodity prices that may play to the advantage of energy producers (CAD and AUD) and against the NZD. Despite a stronger USD, energy prices have been relatively strong.
The chart below shows oil, gas and coal prices. Coking coal export prices from Australia have risen particularly sharply this year, up 178% since January. Oil prices have also almost doubled since lows in January.
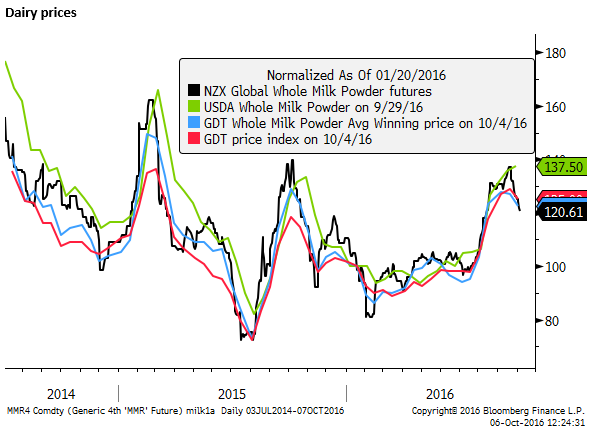
More recently, dairy prices have weakened after a moderate period of recovery since around mid-year.
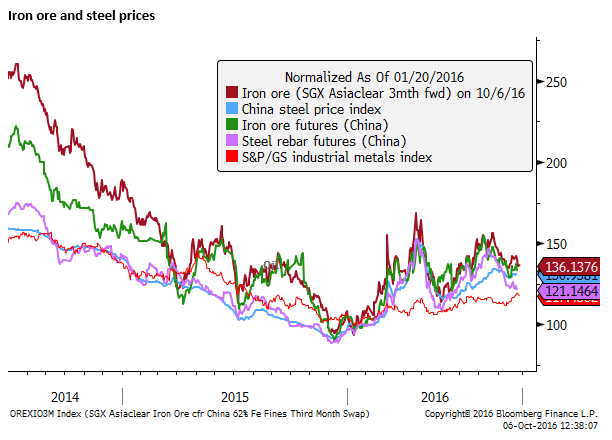
For a pure energy play, CAD has an advantage over AUD, the latter is equally linked to the steel market as a large exporter of iron ore. More recent iron ore prices have fallen from a recent peak in mid-August.
Revisiting our AUD/NZD fair value model
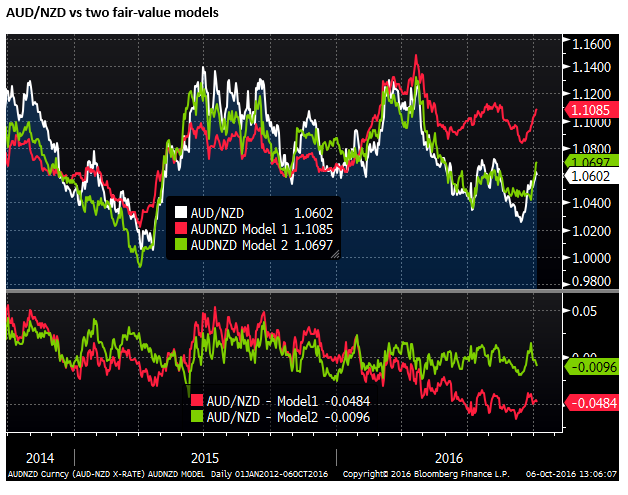
On 25 August we presented two basic fair value models of AUD/NZD. The first model compared the cross to an index of relative commodity prices and the 2year swap interest rate spread, using weekly levels data over 250 observations (around a 5-year period).
In the second model, we added in the JP Morgan Aggregate Global Bond Yield index over a shorter period of 250 daily observations. The idea was to attempt to account for additional gains in the NZD that may be related to investors’ ‘reach for yield’.
Both models appeared to provide considerable insight into the behavior of the AUD/NZD cross. See our original report for details and further discussion (AmpGFX – RBNZ Communication failure and AUD/NZD fair value, 25 August).
Below we show the updated chart of the two models. Model 1 is the medium term model based only on relative commodity prices and the yield spread. It remains well above the AUD/NZD, continuing to suggest that the pair is under-valued. It is interesting to note that the model value has risen recently, in-line with the recovery in AUD/NZD. It suggests that the rise in AUD/NZD is partly accounted for by a rise in coal prices, while milk prices are weaker. (Discussed further below).
Model two has also risen in-line with the AUD/NZD, albeit more recently. It suggests that AUD/NZD has risen in part due to a rise in global bond yields, potentially diminishing the extra demand for NZD related to a global investors’ ‘search for yield’ (also discussed further below).
AUD/NZD responds to commodity prices
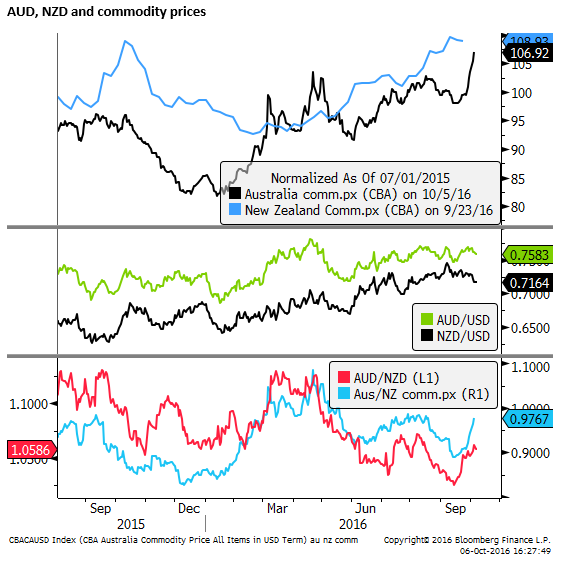
The chart below shows the commodity prices indices used in these models (from The CBA). More recently, the Australian commodity price index has risen to a high for the year, no doubt boosted by the surge in coking coal prices, more than offsetting a decline in iron ore prices. The New Zealand price index remains near its high for the year (last observation was on 23-Sep), but it might be expected to ease back in-line the recent dip in dairy prices. The relative price index has, therefore, risen in favor of the AUD/NZD over the last month, helping account for the recovery in AUD/NZD.
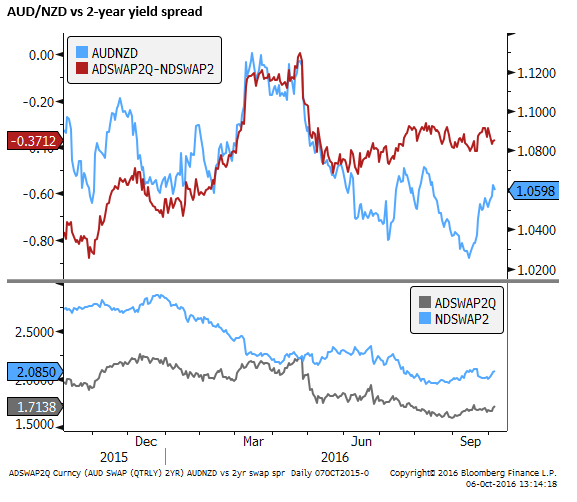
The chart below shows the 2-year swap rate spread. This has not changed much over recent months, offering little reason for the cross to move.
‘Search for yield’ premium for NZD may decline
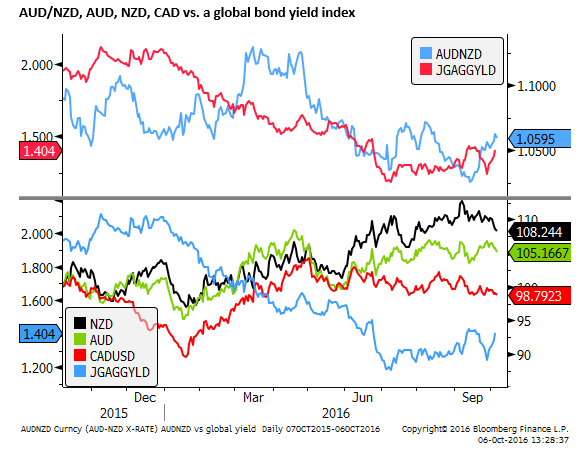
The chart below shows the AUD/NZD against the JP Morgan Aggregate Global Yield index. Yields have been relatively volatile recently, rising after the 8 Sep ECB meeting where it failed to meet expectations that it would expand its QE program. This dovetailed with reports ahead of the 21 September BoJ policy meeting that it was planning to adjust its policy to encourage a steeper yield curve. It appeared that these major central banks were seeing limits to QE and worried about excessively low and flat yield curves, dampening financial industry profits and weakening the transmission of monetary policy. Yields tended to rise in response.
However, yields fell back on mixed reviews on the 21 September BoJ policy and downward revisions to long run rate expectations by the USA FOMC later the same day. Yields reached a recent low on risk aversion related to Deutsche bank.
Yields have bounced again in the last week as the JPY has weakened in the new Japanese half financial year since end-Sep, helping generate a re-think on the BoJ Yield Curve Control policy. Commodity prices, in particular, oil, have recovered further in recent weeks, supported by evidence of improving global demand, UK and USA economic data have been better than expected, helping lift rate hike expectations in the US and lessen chances of more policy easing in the UK. The market may be responding to increasing trends globally towards fiscal expansion. Deutsche Bank’s share price has stabilized and, in recent days, un-named sources have been reported to say the ECB is looking ahead to a time when they may decide to taper in QE policy.
Falling global bond yields have tended to generate a ‘search for yield’ that has boosted high-yielding currencies, such as NZD, and to a lesser extent AUD, even as they have cut rates this year. The recent rise in yields may tend to see some of this high-yield demand for NZD decline.
CAD/NZD set to fall further
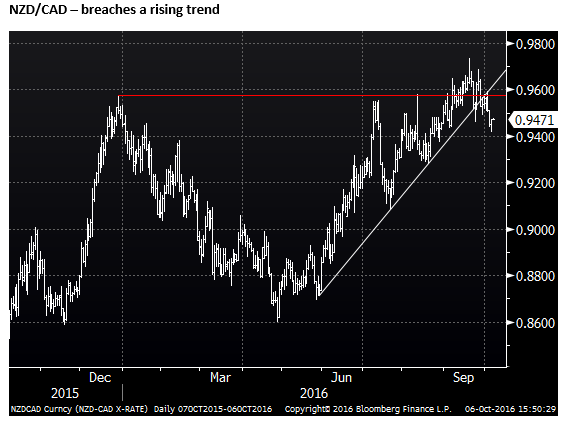
If the two key factors that account for a recovery in AUD/NZD are relative commodity prices and higher global yields, then we might also expect the NZD/CAD cross to fall.
The potential downside for NZD/CAD might be even more significant considering that CAD is a more pure energy play, and CAD is a relatively low yielder and is likely to be much less influenced by a ‘search for yield’ and, therefore, a recovery in global bond yields.
Fair-value model for CAD/NZD
We wouldn’t expect to be able to achieve as tight a relationship in the NZD/CAD to variables such as relative commodity prices and yield spreads as we do with AUD/NZD. The Australian and New Zealand economies are much more closely interconnected by trade, finance, and immigration. In the same way that Canada and the USA are related. Other factors come into play, including broad developments in the USD and the US economy, in determining the direction on NZD/CAD. And in general, we would expect more random noise.
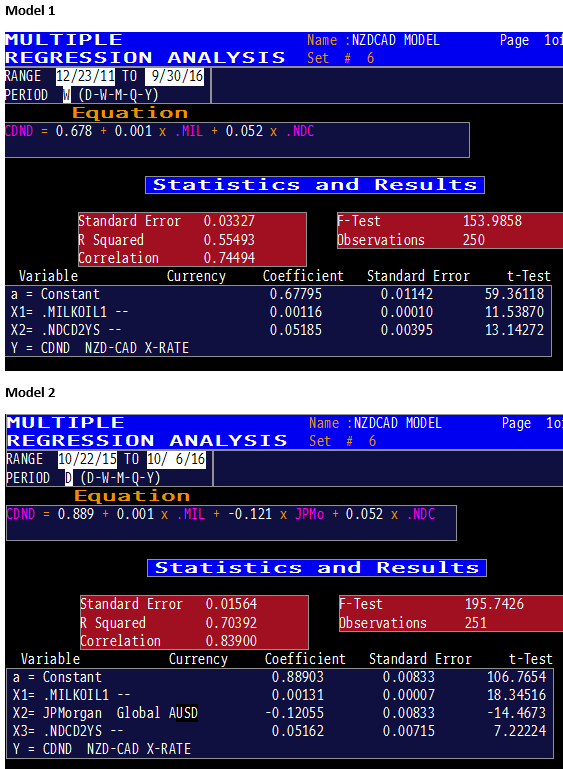
Nevertheless, we conducted the same multiple regression analysis on NZD/CAD; using the 2-year swap rate spread, and relative commodity prices (over a medium term period of weekly observations). And over a shorter period of daily observations adding in the JP Morgan global yield index. The latter model attempts to capture the extra demand generated by the ‘search for yield’ in an extreme low global yield environment.
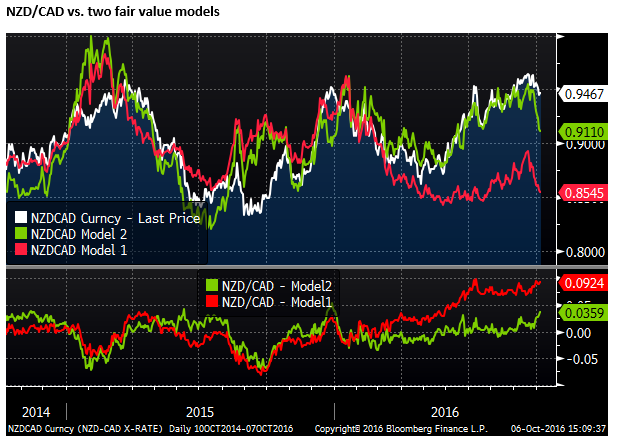
The chart below illustrates the results. It sends a similar message to the AUD/NZD analysis. Without a global yield proxy for a ‘search for yield’ the NZD/CAD appears to be significantly over-valued, more-so than AUD/NZD was under-valued. In the NZD/CAD instance, it is over-valued by 9.25 figures (2.8 standard errors). This is consistent with the notion that CAD is further down the totem-poll in that ‘search for yield’ than the AUD.
Note that for a relative commodity price index we have used milk futures in New Zealand relative to oil price futures in the USA. As such, we have picked up the most recent decline in milk prices in this analysis. (Note in our discussion above for AUD/NZD, the analysis used the CBA commodity price indices, and the latest data did not pick up the recent fall in milk prices).
Incorporating a global yield proxy, NZD/CAD still appears overvalued, but by a lesser amount. This time by 3.6 figures (although this still represents 2.3 standard errors in this shorter term model).
An opportunity to sell NZD/CAD
It seems, therefore, there may be an opportunity to sell the NZD/CAD, anticipating that it might close this over-valuation gap; assuming you agree with the notion that relative commodity price developments matter and that the recent back-up in global bond yields might reduce the pre-occupation of global investors in bidding up higher yielding currencies.
Additional factors that might argue for a weaker NZD/CAD are that there is a high likelihood that the RBNZ will use its last meeting of the year on 10-November to further cut interest rates. Currently, the rates market has priced-in a 67% probability that it cuts by 25bp.
The most recent reports from the real estate sector and mortgage growth indicators suggest that the latest RBNZ macroprudential measures introduced on 1 October are dampening activity in the New Zealand housing market. This might be expected to increase the scope for the RBA to cut rates and continue to jaw-bone for a weaker NZD.
Recent Canadian economic data have been mixed as it recovers from a Q2 slump in activity related to the Alberta wild-fires. However, the BoC is likely to wait to see how fiscal stimulus measures play-out in the second half of the year. Recent evidence from the USA economy is also more encouraging, with stronger than expected vehicle sales and service sector PMI. USA core capital goods orders have also improved in the last three months. Higher oil prices are also expected to help stabilize the US energy sector. The BoC is more likely to leave rates on hold for the foreseeable future.