Headwinds stiffen for Australia
We are at an interesting juncture where higher US yields may contribute to stronger USA investor confidence. Businesses may sense that the interest rate cycle has turned encouraging them to accelerate plans to borrow and spend. On the other hand, higher-yielding countries that have experienced a rise to record and dangerous levels of household debt, Australia and New Zealand, have economies that are threatened by higher interest rates. US economic data is showing more strength supporting the case for higher rates in the USA. Australian capital expenditure and building approvals data suggest the economy is stalling. While the USA appears to be moving forward with infrastructure spending, the Australian government feels hamstrung by threats of a rating down-grade. We have noted that a rising yield environment is a threat to high yield currencies, like the AUD and NZD, that out-performed earlier in the year as yields fell to record lows. We see risk building for more significant falls in AUD and NZD.
No let-up in capital investment slump
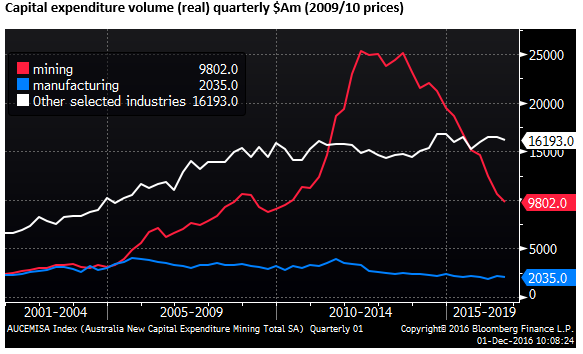
The Australian capital expenditure survey showed that the mining investment down-turn is yet to let-up, despite the recovery in commodity prices this year. The RBA has estimated that the mining investment down-turn is about 80% complete, suggesting that it may bottom-out in the next year. However, there is little sign in the latest capex survey that there will be any recovery for the foreseeable future, and the tepid recovery in non-mining investment may also have lost momentum.
Total capex volume fell 4.0%q/q in Q3, down 13.7%y/y in seasonally adjusted terms, pointing to a significant drag on Q3 GDP. Some analysts see a risk of a negative Q3 GDP print.
Mining capex volume fell 7.2%q/q s.a. (-33.0%y/y), manufacturing fell 4.9%q/q s.a. (-3.1%y/y), other selected industries fell 1.9%q/q s.a. (+0.2%y/y).
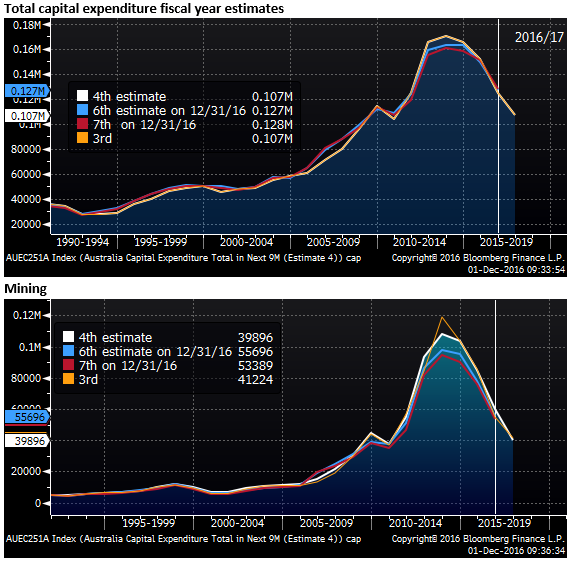
The capex survey also generates progressive estimates of the current fiscal year ended Jun-2017. On Thursday, the fourth of seven estimates was released, along with the final seventh estimate of the previous fiscal year ended Jun-2016.
The estimates tend to rise through the first three to five as companies firm up their plans for the year, and then level off and decline through estimates 4 to 7. As such, economists tend to adjust estimates using a so-called realization ratio, or, more simply, compare the change in the estimates from the corresponding estimate in the previous year.
Estimate 4 for the current fiscal year ended Jun-17 was 14.3% lower than estimate 4 in the previous fiscal year; the third year in a row of rapid retreat led by the mining sector. The mining sector estimate fell 33.6% from a year earlier.
The increase in estimate 4 from estimate 3 for the current fiscal year was very slim and below par after adjusting for the historical pattern. It rose only 1.3%, and adjusting this by a realization ratio would suggest this was a downgrade. For instance, using an average of outcomes over the last five years, the adjusted change was a fall of 2.1%.
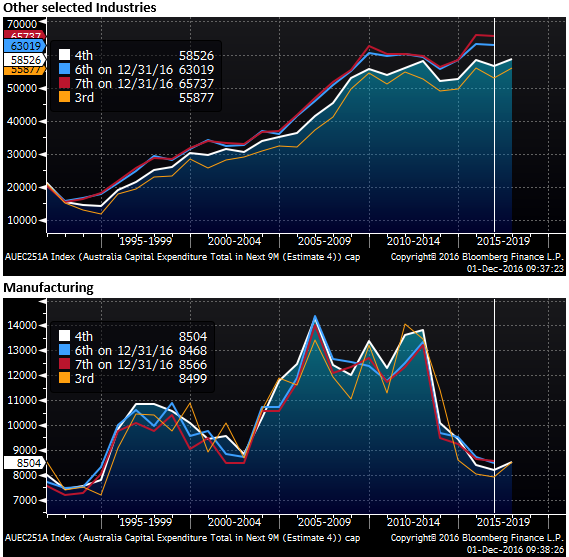
At its peak, a few years ago, Mining investment accounted for around 60% of the total in this capex survey. Now it has retreated such that the largest component is “other selected industries”. Manufacturing is the third and lesser component, accounting for only around 8% of the total.
The market is on the lookout for a recovery in “other selected industries” investment to help lift confidence that the economy is transitioning to sustainable growth in the wake of the mining investment down-turn. It has recovered moderately in recent years, but appears to have lost some momentum this year.
Estimate 4 for other selected industries was a modest 3.7% higher than estimate 4 for the previous year. It was 4.7% higher than estimate 3 for the current fiscal year, but after applying a realization ratio based on the average outcome over the last 5 years, this adjusts down to a fall of 1.4%.
The RBA has noted that the capex survey captures only around half of non-mining investment measured in the national accounts. Nevertheless, it is the most comprehensive available and points to a still sluggish outlook.
Other indicators of business are mixed
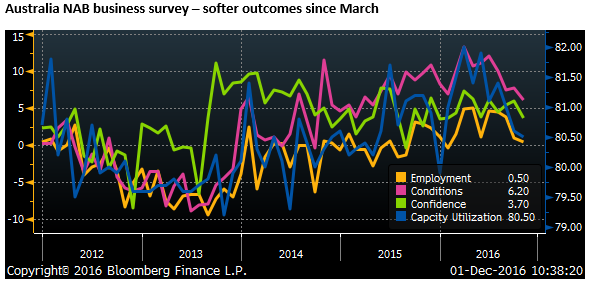
Other indicators of business activity are not as weak as the capex survey. The RBA noted in its November quarterly Statement on Monetary Policy that, “Survey measures of business conditions in the non-mining sectors have been above average for some time.” And it notes that investment in those service sectors and intangible capital such as software not covered by the capex survey have grown “relatively strongly”.
However, the most recent monthly NAB business survey for October has shown a deteriorating trend in current conditions and capacity utilization since March, and softer outcomes for employment and confidence in the last few months.
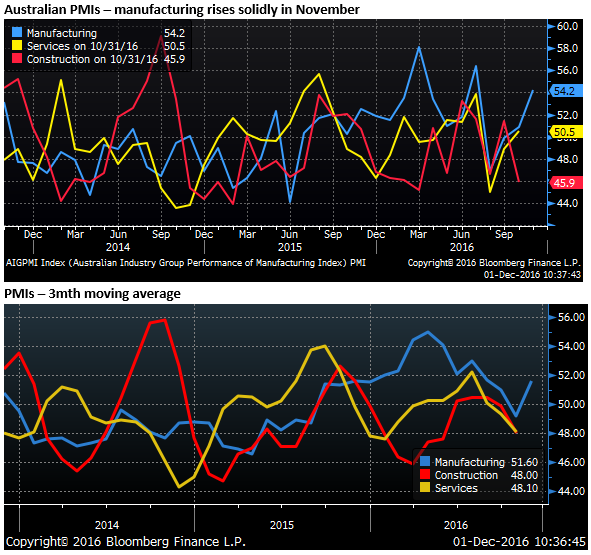
There was a glimmer of better news in the Australian manufacturing PMI for November rising from 50.9 to 54.2. This series is more volatile in Australia compared to PMIs in other major countries, and it has been quite volatile this year. As such, we can only take so much from this indicator, and manufacturing is a small part of the economy.
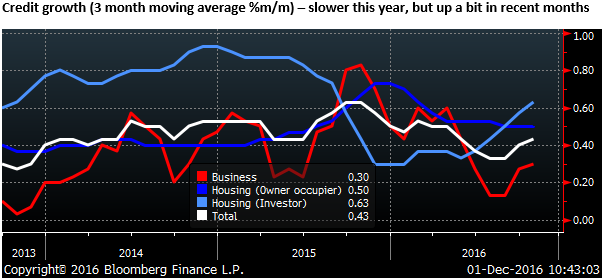
Credit growth in Australia has been more subdued in the last year, but has picked up a bit in October for business and investors in housing. The chart below shows the three-month moving average for key components of credit. Business credit slowed since reaching a recent peak in Q4 last year, but improving somewhat in October.
Credit to housing investors has picked up since mid-year after slowing over the previous year (as banks tightened lending standards in response to regulator prudential measures).
Building approvals retreat
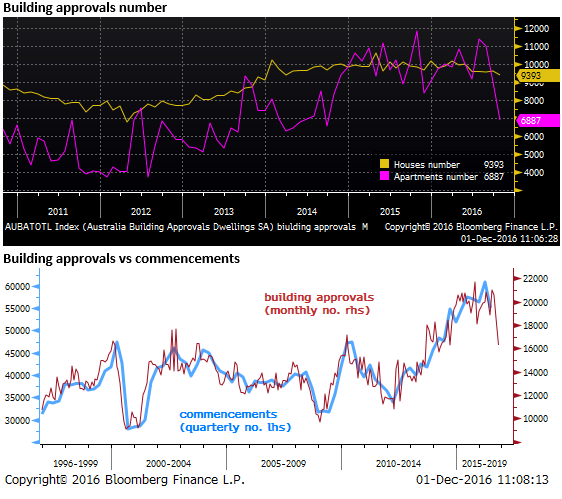
While the outlook for non-mining business may be reasonably stable, residential construction has been a major component of the non-mining recovery. Prospects for this sector are now peaking; Building approvals fell 24.9%y/y in October.
Apartment glut generating higher financial and economic risks
The sharp decline in building approvals was led by apartments and comes after a surge in apartment approvals over the last two years fueling an over-supply in inner-cities in the major Eastern cities, particularly Melbourne and Brisbane, and to some extent Sydney.
There is a growing disparity in house price trends across states and segments within cities. Melbourne apartment prices were reported to have fallen a rapid 3.2%m/m in November (CoreLogic), while the national housing price index rose 0.2%m/m.
CoreLogic also reported that the average rental yield across capital cities fell to a record low of 3.2%, posing a risk to the renewed growth in investor demand, especially as bond yields are rising.
House prices still growing but rental returns hit record low: CoreLogic – TheAustralian.com.au
The RBA has highlighted inner-city apartments has a financial stability risk and the more rapid decline in Melbourne apartment prices highlights that risk. The main eastern cities are only on the cusp of the big rise in new apartment supply coming on stream over the next two years. We discussed this in more detail in our 21 October report (Apartment glut fears may have hit the AUD and NZD – AmpGFXcapital.com).
Australian banks’ exposure to this sector of the housing market is relatively small compared to their overall balance sheet, and they have applied more conservative lending standards to investors in this sector. As such, there is little risk of a banking crisis.
A good deal of the apartment market is intended for foreign buyers, particularly from China. But Australian banks have virtually halted lending to foreign investors, no longer accepting foreign sourced income in loan applications.
Many Chinese investors need credit to complete apartment purchases, due to Chinese government capital controls on its citizens’ outflows. This is generating a significant risk of weakening demand, and is forcing more financing for investors and developers onto shadow-banking sources and foreign banks. As such, there is much uncertainty over the degree of stress and fallout from a glut of apartments on the Australian economy.
An apartment glut lurks somewhere between a modest drag and a significant drag on the economy. There is some risk that it spills over to weakness in the broader housing market, which would be a bigger problem for bank profits and household confidence. The risks are more significant in a rising global yield environment.
Foreign investors may be lured to other markets
A key uncertainty is the strength of demand from foreign investors (mainly from China). Capital controls are reported to have been tightened in China to contend with sustained outflow this year. On the other hand, Chinese private and company demand for foreign exchange has increased significantly, and authorities are battling against a strong tide of outflow. China may persist as an active component of demand for foreign property.
We also wonder how Chinese investors see the Australian market in comparison to other potential destinations for property investment. Certainly, Australia is not the only option, and a number of countries around the world have experienced increased real estate investment from China.
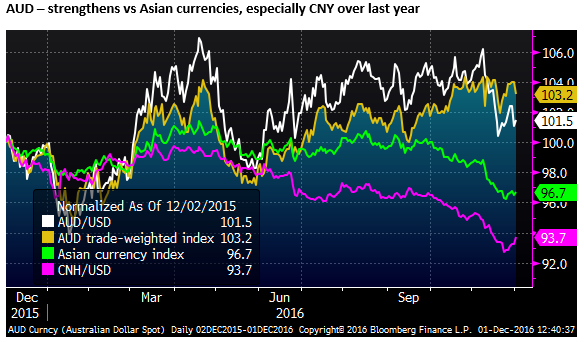
The AUD has been relatively strong compared to the CNY exchange rate and indeed most Asian currencies this year. As such, even though the AUD may be modestly weaker against the USD recently, Australian property does not appear cheaper to Chinese investors over the last year. They may be attracted to other more affordable destinations, including the UK and South East Asia. More recently, Japanese property will appear cheaper.
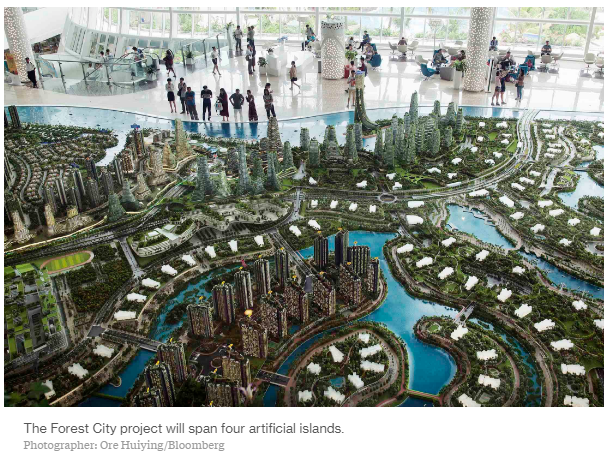
A report from Bloomberg on a massive Chinese-led development in Johor Bahru on the Southern tip of Malaysia, just north of Singapore, represents a major competitor for Chinese residential investor funds. One can be confident that the Chinese developers in this region will aggressively market this development to their homeland.
Bloomberg reports that “The scale of the projects is dizzying. Country Garden’s Forest City, on four artificial islands, will house 700,000 people on an area four times the size of New York’s Central Park. It will have office towers, parks, hotels, shopping malls and an international school, all draped with greenery. Construction began in February and about 8,000 apartments have been sold, the company said.”
“It’s the biggest of about 60 projects in the Iskandar Malaysia zone around Johor Bahru, known as JB, that could add more than half-a-million homes.”
$100 Billion Chinese-Made City Near Singapore ‘Scares the Hell Out of Everybody’ – Bloomberg.com
Country Garden is a Chinese developer that also has projects in Australia. It is reported to have delayed projects in Australia in the last month due to planning bottlenecks at a Sydney local council government. A drop in building approvals in Australia may be symptomatic of Chinese developers shifting focus to alternative countries, like JB in Malaysia
New Zealand housing market peaking
New Zealand’s economy may have more momentum than Australia, but there is evidence that its housing market has also peaked. This is likely to reflect the tougher macroprudential measures (lower loan-to-ratio thresholds) implemented since 1 October.
The RBNZ said in its Financial Stability Review released on Wednesday that, “The Reserve Bank has asked the Minister of Finance to agree to add a Debt to Income (DTI) tool to the Memorandum of Understanding on macro-prudential policy. While the Bank is not proposing use of such a tool at this time, financial stability risks can build up quickly and restrictions on high-DTI lending could be warranted if housing market imbalances were to deteriorate further.”
As such, the RBNZ is currently tackling its excessive housing market price growth with aggressive tactics and bringing on more tools to be used if required.
The QV house price index slowed from 12.7%y/y in the three-months to October to 12.4%%y/y in the three months to November. The REINZ has reported house sales falling from year-ago levels since July (down 14.2%y/y in October).