AUD/NZD struggles; has NZD become less risk-sensitive?
AUD/NZD has fallen back to 1.05 for the first time since July last year; do fundamentals justify this? Will it last? Below is our tour de force analysis of the pair covering rates, commodities, underlying fundamentals and exposure to China. The pair has fallen well below what might be justified by interest rate spreads. However, interest rates have had little impact on the AUD/NZD for the last four or five years. This is surprising given rates were the dominant driver in the preceding decade. More recently, the AUD/NZD may have been undermined by fear of a China/US trade war. We see scope for AUD/NZD to bounce near term, but looking at broad fundamentals, NZD has become less risky over the last 5 to 10 years, and indeed it is proving less sensitive to risk factors.
AUD/NZD cheap vs. rate spread
Since the middle of last year, yield spreads have narrowed in favour of the AUD over the NZD at both the long and short end of the curve from around -45bp to -15bp.
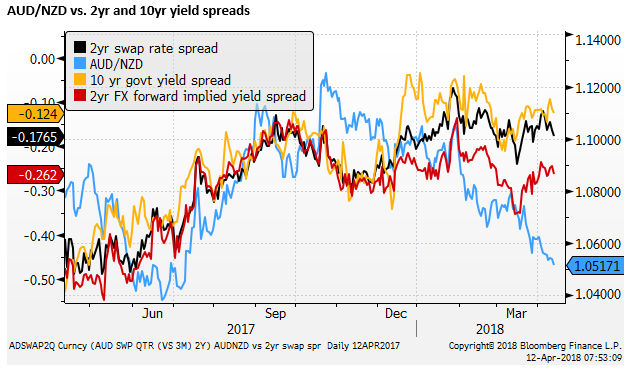
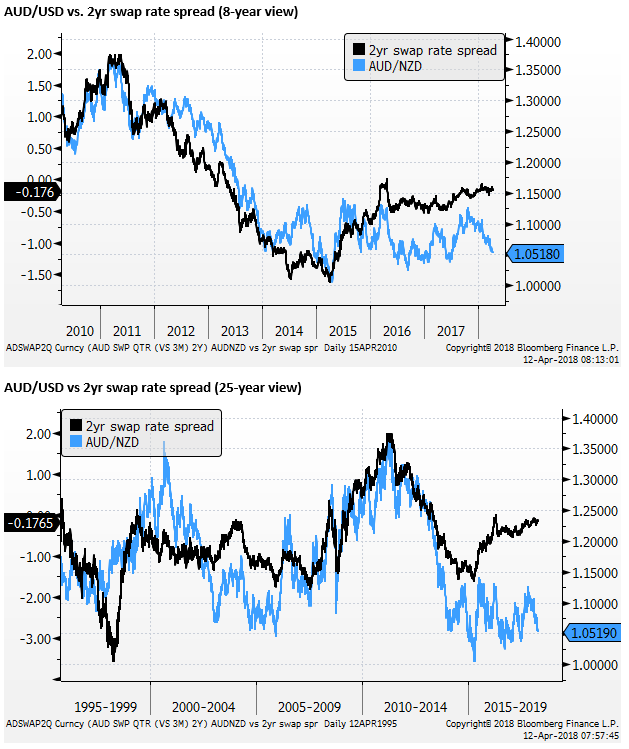
Over the long run, the AUD/NZD looks cheap relative to its 2yr yield spread that is now significantly above its long-run average; rising since 2015, whereas the AUD/NZD exchange rate has been ranging around historic lows since 2015.
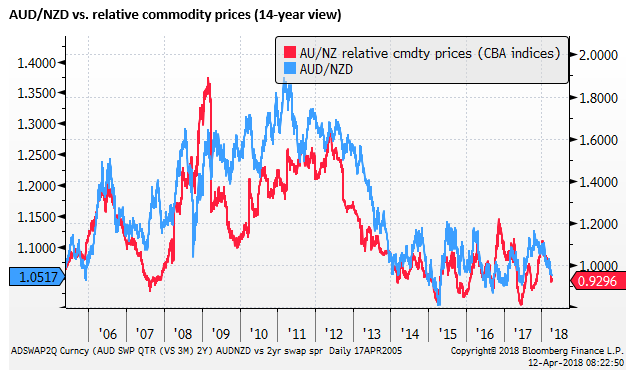
AUD/NZD more consistent with relative commodity prices
While relative interest rates suggest that the AUD/NZD is extraordinarily cheap, relative commodity prices do a better job of explaining the relative strength in the NZD.
Relative commodity prices were cheaper around the middle of last year, falling to a low in June, coinciding with the recent low in the rates spreads, and helping explain the fall in AUD/NZD at that time to around 1.04. Relative commodity prices rebounded to a recent high around January, but have fallen again recently in line with the recent fall in the AUD/NZD exchange rate.
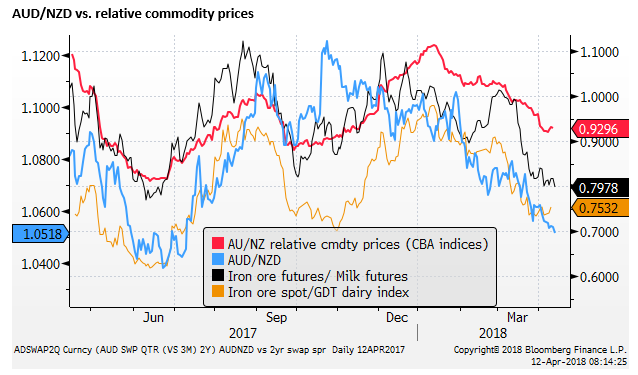
Over the last five years, relative commodity price developments appear to have done a better job in explaining the gyrations in AUD/NZD through a phase of relatively trendless trading in the cross around its historic lows.
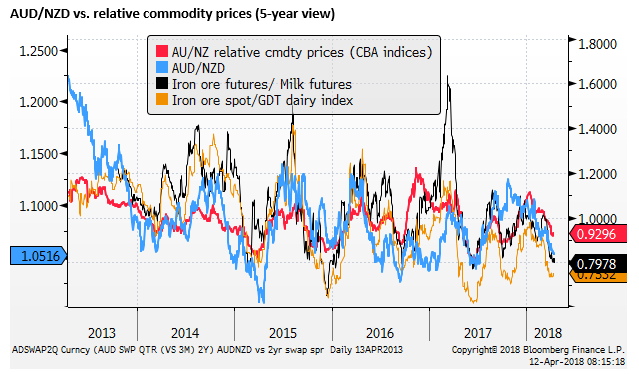
Over the long run, since 2005, relative commodity prices have also done a reasonable job in explaining the exchange rate. Relative commodity prices are around the low over this period, consistent with the historic lows in the AUD/NZD.
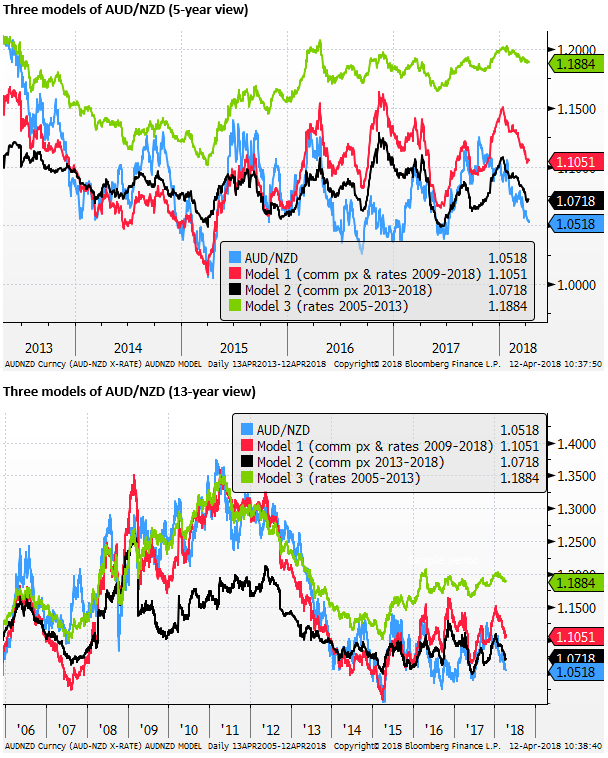
Explaining AUD/NZD with rates and commodities
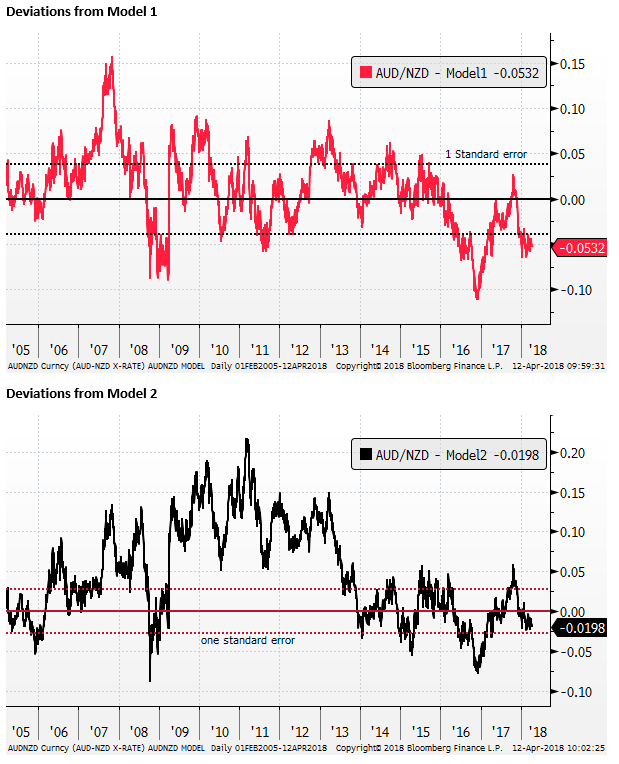
If we use simple linear regression to model AUD/NZD against the 2yr swap rate spread and the relative CBA commodity price index, we find that in the last five years, the rate spread has had little explanatory power, while the relative commodity price index explains only around 24% of the variation in AUD/NZD.
If we model AUD/NZD before 2013 (from 2005 to 2013), the rates spread had around four times the explanatory power of commodity prices, and models were more powerful, explaining around 85% of the variation in AUD/NZD.
If we model AUD/NZD from 2009 to 2018, we find roughly equal work by rates and commodity prices in explaining AUD/NZD, and the models explain around 85% of its variation.
In the chart below we show three models. The Red line (model 1) has both the rates spread and relative commodity prices, using 100 monthly observations from 2009 to 2018. It suggests that the fair value for AUD is currently around 1.105 (1.4 standard errors above spot).
The black line (model 2) has only relative commodity prices, using 250 weekly observations from 2013 to 2015. It suggests that the fair value for the AUD is currently around 1.072 (0.7 standard errors above spot).
The green line (model 3) has both the rates spread and relative commodity price, using 94 monthly observations from 2005 to 2013. It illustrates that if the market regime in place before 2013 were still operating the AUD/NZD would be much higher, nearer to 1.19.
What can we conclude from this simple analysis?
- The AUD/NZD has had a lot of variation in recent years that has had little relationship to either commodity prices or rates.
- Rates, in fact, have been largely ignored by the FX market in recent years. Commodity prices have had a significant but limited explanatory power.
- If we look back before 2013 (from 2005 to 2013), rates explained much more of the variation in AUD/NZD; around four times as much as commodities. However, both had significant explanatory power.
- Before 2013 (from 2005 to 2013), we could explain much more of the variation in AUD/NZD using simple linear regression analysis, and we tended to rely largely on the rate spread. Now we find that AUD/NZD appears much less anchored to these traditional
FX tends to go through regimes when it anchors itself to specific drivers, but these are inconsistent. We cannot tell beforehand when these regimes change. At the moment we should be cautious assuming any model with rates in it would help determine the likely direction of AUD/NZD.
But it is hard to ignore rates since we know they are crucial to actual returns and are highly dependent on underlying economic fundamentals, including central bank policy direction. We should expect that the AUD/NZD will, at some point, pay more attention to the rate spread again.
Commodity prices appear more relevant recently, but they still only explain around a quarter of the variation in AUD/NZD. Commodity prices have probably not become a more powerful explanatory variable in recent years; rather rates have become much less powerful.
In recent years, both the AUD/NZD and relative commodity prices have been in stable trends, and their meanderings have more often than not matched-up. In directionless markets, traders may have paid more attention to commodity prices.
The rate spreads between AUD and NZD have moved gradually narrower in favour of the AUD in the last year. Not so aggressively to demand traders’ attention. With the USD diverging significantly from its rate spreads with most other currencies, including both the AUD and NZD in the last year or so, it is probably the case that traders have also lost their focus on the rate spread between AUD and NZD.
We have to be wary that at some point investors will again swing back to consider the rates spread between AUD and NZD. Secular trends and broader fundamental concerns related to twin deficits and political uncertainty might explain the divergence in the USD from its rates spread, but there is less reason to see AUD/NZD sustaining a divergence from its rates spread.
We do not place much faith in any of these models’ ability to predict the AUD/NZD. Not least because they are unsophisticated and have been used mainly to illustrate a few observations. But we might conclude that the AUD/NZD appears cheap, especially with respect to relative interest rates. However, we cannot tell when rates may return as a driver for this cross. AUD/NZD’s decline is only partly explained by softer Australian commodity export prices relative to New Zealand.
NZD has become less risky
In the past, New Zealand was a seen as a higher risk country, and needed to offer a higher yield than Australia to underpin the AUD/NZD exchange rate. However, this may no longer be the case. The close of the risk gap could explain a decline in the AUD/NZD over the last 5 to ten years relative to the interest rate spread.
In particular, the New Zealand government returned to fiscal surplus in 2015, Australia does not expect to be there for another three years.
New Zealand’s net national liabilities have fallen significantly to be around the same as in Australia. And Australian households are more heavily indebted relative to their income.
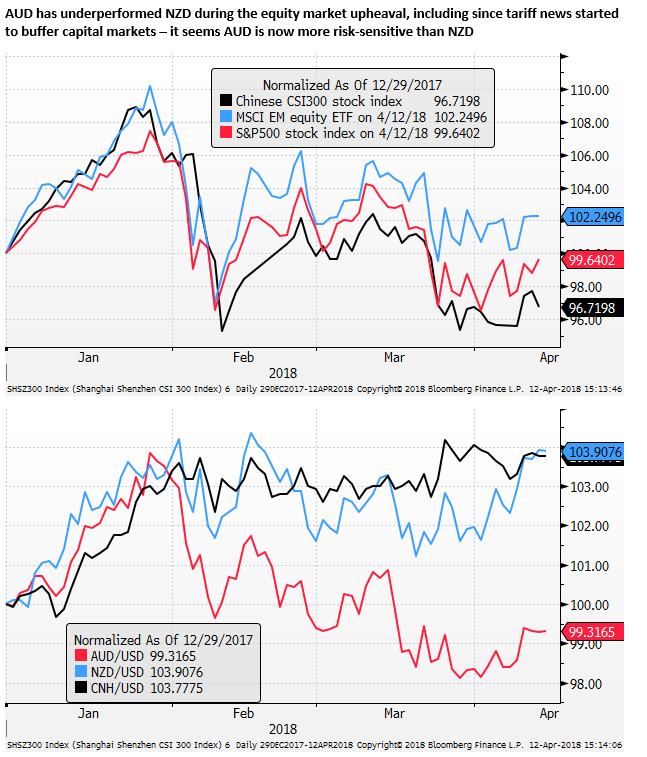
AUD may be more exposed to China
Another aspect may be that AUD is the go-to currency to reflect risks in the Chinese economy and financial sector.
One reason this may be the case is that around 33% of Australia’s goods exports go to China.
New Zealand also counts China as its top export destination, but China takes around 22% of New Zealand’s goods exports. It might seem then that Australia is more trade-exposed to China
However, New Zealand also sends around 17% of its goods exports to Australia. So directly to China, and through Australia, New Zealand is arguably similarly exposed to developments in China and Asia more generally.
It may be the case that Australia is more exposed to the industrial sector in China, given its commodity exports to China are mostly for steel-making. Australia is also a major exporter of energy commodities, (coal and natural gas); mostly to Asia, including large shares in its trade with Korea and Japan.
The industrial sector might be regarded as more cyclical and at risk to financial sector reform. As China adjusts towards a more service and consumer-driven economy, and increases scrutiny on borrowing by the corporate and state-owned sector, industrial commodities, and Australia, are likely to more exposed to any economic fallout in China.
In recent months, the AUD/NZD has tended to fall as global markets worried about the impact of a trade war between the US and China. This may reflect a sense that AUD is the primary proxy for economic and financial risk in China.
It also follows that we might expect AUD/NZD to recover somewhat if the market views the conciliatory comments by Presidents Xi and Trump in the last week as lessening the fear of fallout from the trade dispute.
Additional issues that might add to AUD risk over NZD in the coming year include the relative state of housing markets in the two countries. New Zealand’s, more recently, appears to be stabilising, Australia’s less so.
The political cycle may start to favour the NZD. The change in NZ government last year may have helped push AUD/NZD towards its 12-month peak near 1.12 in Q3. As uncertainty ebbs in NZ, it may start to pick up in Australia into its election early next year, with the incumbent LNC government lagging in the polls since Q3-2016.
The Royal Commision int0 misconduct in the banking and financial services sector in Australia may also be dampening confidence in the AUD, undermining bank share performance and increasing risks of tightening credit conditions over the coming year. However, Australian banks largely own New Zealand banks, and policy changes in Australia are likely to filter across to New Zealand.
External balance
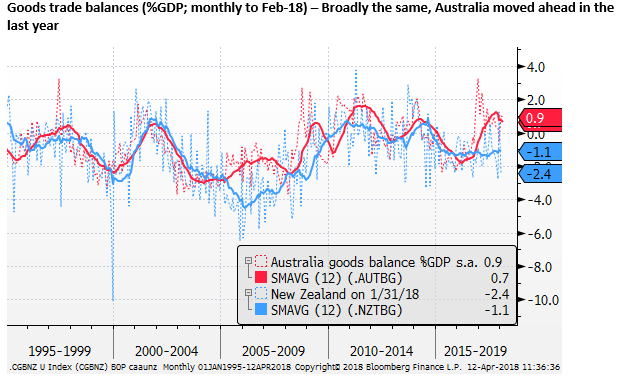
The chart below shows the goods trade balance for Australia and New Zealand. Broadly the two have moved together over the long-term. In the last year or so, Australia’s goods trade balance appears to have moved into a more persistent surplus (averaging 0.7% of GDP in the 12 months to Feb), New Zealand’s goods balance has averaged a 1.1% deficit over the last 12 months.
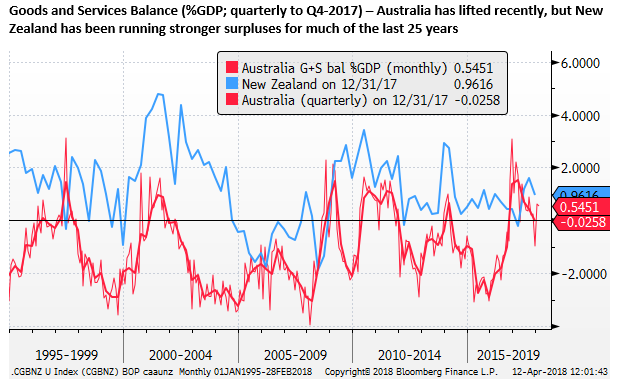
New Zealand’s external balance including net services exports has been better than Australia, posting more persistent surpluses over the long term.
However, relative to New Zealand, Australia’s net Goods and Services surplus has jumped in the last year or so, reflecting its shift from the investment to the production phase of its mining boom.
In the last year, both Australia (+0.7% of GDP) and New Zealand (+0.9% of GDP) have posted similar modest Goods and Services surpluses.
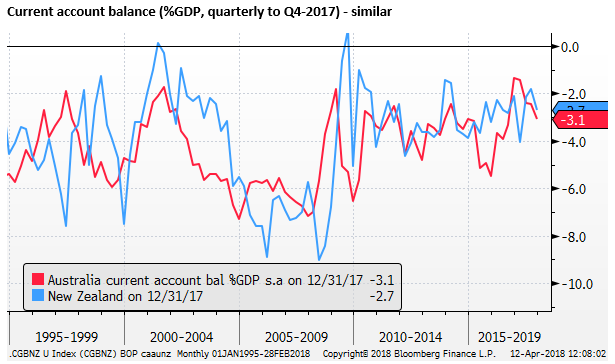
If we compare current account balances, we find that Australia and New Zealand have very similar trends over the long term. Both have significant net income deficits that drag down the balance into deficits in the order of 3% of GDP.
Fiscal position – New Zealand moves ahead
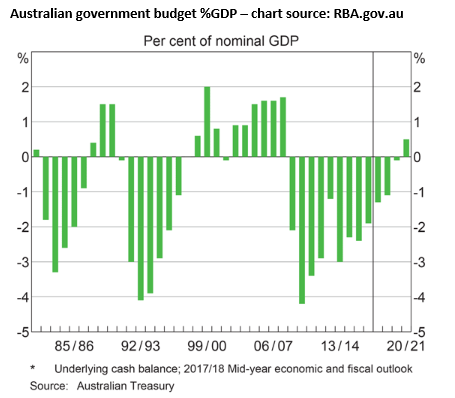
On budgeting, the New Zealand government has been more successful than Australia in returning to surplus.
In its December update, the Australian Treasury predicted an underlying cash balance deficit of 1.3% of GDP for the FY ending in June; projecting a gradual return to a surplus of 0.5% of GDP in 2020/21 (three-years).
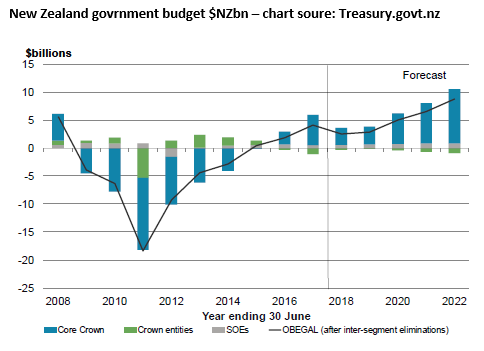
In its December update, The New Zealand Treasury predict an operating surplus before gains and losses of 0.9% of GDP for the fiscal year ended June; in surplus since 2015. It is expected to rise further to 2.5% of GDP over the next four years to 2021/22.
Both countries have significantly better fiscal balance on average than other G7 and emerging market economies; USA (-3.7% of GDP), Euro Area (-1.0%), UK (-2.7), Japan (-3.3%), emerging Asia (-3.9% GDP), emerging Europe (-2.2%), Latin America (-6.4%). – (source: IMF Fiscal Monitor, 2018 overall balance).
Net Government Debt
New Zealand net core Crown debt is forecast at 21.7% of GDP in June this year, projected to fall to 19.3% of GDP over four years.
Australia’s net debt is forecast at 18.9% of GDP in June this year, projected to rise to 22.1% of GDP over three years.
Both countries’ government debt levels also compare favourably internationally. Net government debt: USA (81.1%), Euro Area (70.3%), UK (80.6%), Japan (120.7%), G20 Emerging (45.2%) . Gross government debt: emerging Asia (51.5%), emerging Europe (32.6%); Latin America (62.8%).
National Debt – New Zealand has improved markedly
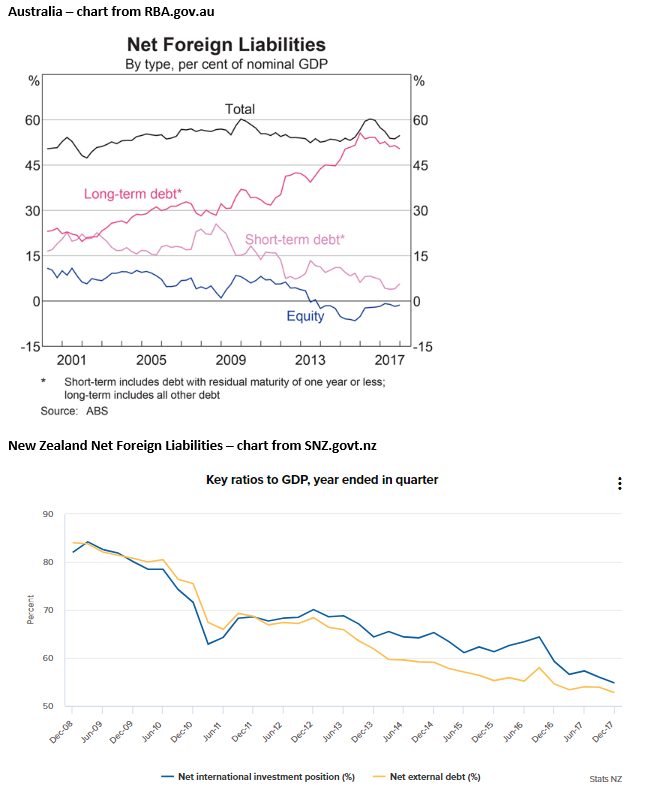
While Australia and New Zealand government sectors have relatively low net debt, as a nation both have more significant net foreign liabilities, reflecting largely net household liabilities.
Australia’s net international liabilities (both debt and equities) was 55.3% of GDP and end-2017. New Zealand’s net liabilities were almost identical at 54.8% of GDP.
However, New Zealand has significantly improved in its net liability position falling from over 80% of GDP in 2008. In contrast, Australia’s net liabilities have remained largely unchanged over the same period.
Household debt
Households in Australia and New Zealand are more highly indebted relative to their income than most other countries, owing largely to the faster appreciation of their housing prices, financed by mortgages.
Australia’s has grown more rapidly than New Zealand’s, rising to 189% of disposable income at end-2017; up in the last 5-years from 160% of GDP.
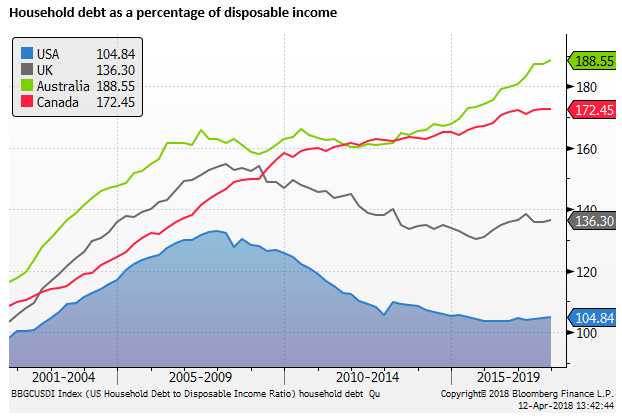
New Zealand’s household debt has risen to 168% of disposable income, rising in the last 5-years from 148%
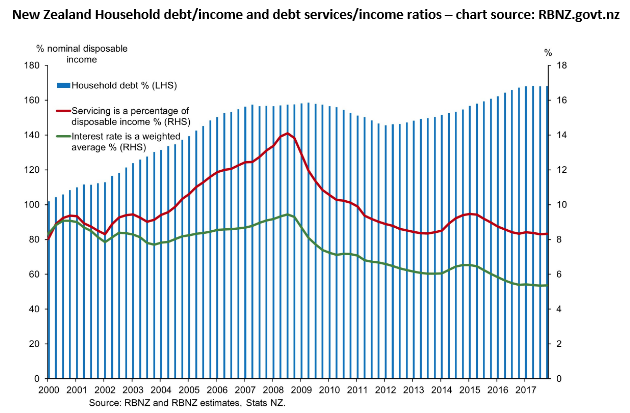
The rise in debt in both countries has been facilitated by lower mortgage rates. As the chart above shows, debt service as a share of income in New Zealand has fallen over the last five years, despite rising debt. The same is true in Australia.
Nevertheless, the higher debt levels suggest that households in Australia and New Zealand will be much more interest rate sensitive than historically and in comparison to other major economies.