AUD pulled harder in opposite directions
The AUD is being pulled harder in opposite directions with the labour data suggesting the non-mining sector is coming to life, but weaker commodity demand in China and weak energy prices are dragging harder from below; best to stay on the side-lines for now. Oil prices appear to be responding to concerns over too much supply. The ECB has said low oil prices are a contributing factor to its assessment that more policy easing may be required. We stick to our weaker EUR view, as other major CBs are more prepared to look through the dis-inflation risk.
Australian non-resource sector coming to life
The very strong employment report in Australia today makes it hard to know which way to turn on the AUD. On the one hand the negative news on demand for Australia’s commodities and terms of trade deterioration appears to be intensifying. On the other, the employment data today provide a significant plank in the argument that the non-mining sector is building up sustainable momentum to offset the mining sector down-turn, suggesting that the AUD is already weak enough to stabilize the economy.
The Australian rates market has responded significantly to this development. 3yr bond yields are 12bp higher from their close yesterday.
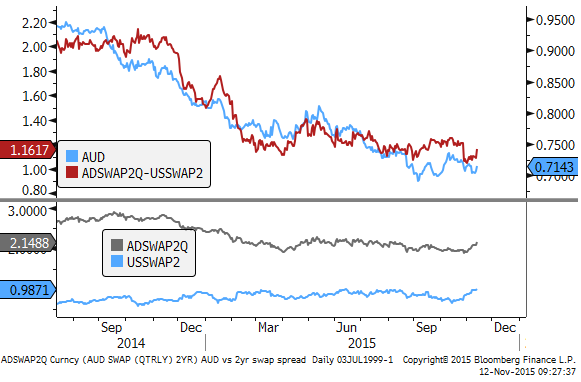
The chart below shows the 2yr swap rate spread for the AUD/USD and the USA and Australian swap rates in the lower panel. The rate spread is up today, and largely little changed since February. It was at a new low for the year at end-October as the market speculated about another rate cut in Australia, and rate hike expectations started to creep back into the US curve. Since then the rate spread has risen only modestly as Australian rates have increased in concert with US rates. The prospect of a US rate hike in December will be a factor helping prevent a bigger rebound in the AUD.
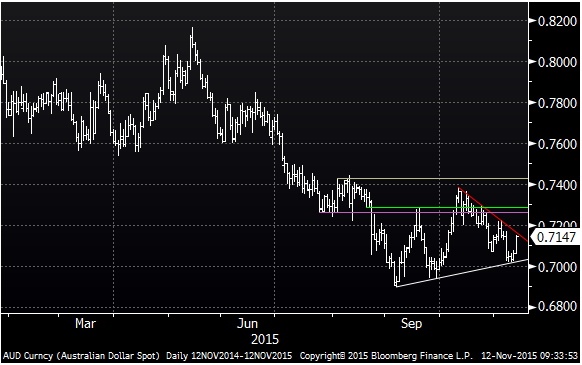
Nevertheless, if Australian domestic data remains solid through the rest of the year, it is possible to see further near term gains in the AUD. It has held an uptrend support in recent days, and is now testing a downward trend. A break above this wedge suggests a test towards resistance levels between .7260 and .7430.
Weaker Commodity trend shows no sign of abating
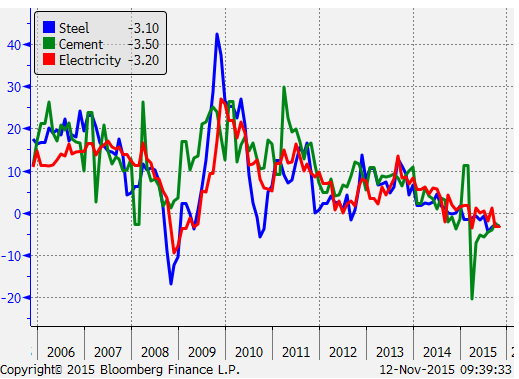
The Chinese data out this week support the case for a weaker AUD. Key industrial activity data remained in decline. Crude steel output fell 3.1%y/y in Oct, down from -3.0%y/y in Sep, Steel product output fell 0.2%y/y in Oct, up from -0.6%y/y in Sep, Cement production fell 3.5%y/y in Oct, down from -2.5%y/y in Sep, Electricity Output fell 3.2%y/y, down from -3.1%y/y in Sep.
The outright decline in these key output measures, consistent with the drag from heavy industry and the construction sector, are noticeably weaker than the headline industrial production measure that nonetheless slowed to +5.6%y/y in Oct, down from 5.7% in Sep, below 5.8%y/y expected, revisiting the previous low in March this year, close to the low in 2008.
The weakness in these sectors continues to weigh on key commodity prices in Australia and suggests they may fall further yet. The Australian terms of trade are also influenced by the weaker trend for oil prices which are important for contract prices in natural gas and to some extent coal. Coal has the further disadvantage of finding less international demand and investment due to its higher green-house gas emissions.
The chart below shows the AUD vs the CBA commodity price index for Australia. This index is at new lows since 2006, suggesting bounces in the AUD should be limited.

Oil prices weighed down by glut fears
Oil prices fell sharply overnight to breach the low in September on the Brent contract, and revisit the low since August on the WTI contract made in late-October. Oil has now fully retraced the significant bounce from the low side of its range in late-Oct/early-Nov to the upper half of its range for the last five months.
It appears that the market has reverted to worrying about excess supply again. On Tuesday, the Saudi oil minister suggested they were not backing down from maitaining its pace of output designed to retain market share and squeeze more marginal players. News reports are discussing increased output from Iraq. The market appears to be sweating on the US inventory number to be reported by the EIA today. The risk appears again tilted towards a weaker oil price and a sustained move below the lows in recent months will further weigh on sentiment.
Lower oil prices were mentioned by ECB president Draghi last month as a factor that the ECB may respond to with its consideration of further policy easing.
Lower oil prices may to some extent delay or slow Fed policy tightening, but this is still more likely to stay on track. The biggest part of the retrenchment in the energy sector in the US may have already past, and while lower oil prices may further drag on this sector, they may also further enhance demand across the economy. Lower energy prices continue to represent a potential source of strength in global consumer spending, so it may do little to dampen overall risk appetite further, especially if it emboldens monetary policy easing expectations in some countries. As such, we expect the Fed to stay on course for policy tightening and the ECB to lead the race towards more policy easing, providing the case for a weaker EUR.
Economic news
- Australian jobs rose 58.6K in October, well above 15K expected. They were revised up slightly in Sep from -5.1K to -0.8K
- The unemployment rate fell significantly from 6.2% to 5.9% in Oct, stronger than 6.2% expected. This is the lowest rate since May-2014, and the ABS trend estimate is now declining gently for the last year.
- Full-time jobs rose 40K, part-time jobs rose 18.6K.
- The participation rate firmed from 64.9% to 65.0%, completing the picture of a strong report.
- As discussed in yesterday’s report this improvement is consistent with the business and vacancy surveys and suggests that the more employment intensive service sectors have kicked into action, helping support the transition from mining. It is a bullish report for the AUD and will keep the RBA on the side-lines for some time.
- Australian Inflation expectations survey showed a rise in the weighted median of responses from 2.4% to 2.7%. Not a number that receives much attention, but the rise may be surprising after the weaker than expected Q3 inflation outcome and downgraded RBA inflation outlook in its November Statement on Monetary Policy.
- New Zealand consumer confidence rose from 114.9 to 122.7 in Nov, a third rise in a row from a low since 2012 of 110 to a high since May 2015. Now slightly above its longer run average since 2004 of 119.
- New Zealand manufacturing sector PMI was 53.5 in Oct, down from 55.0 in Sep (revised down from 55.4). This measure has eased modestly from levels around 56 in 2014 and early this year.
- Japan machine orders growth rose from -3.5%y/y in Aug to -1.7%y/y in Sep, stronger than -4.6% expected
- UK RICS housing market balance was 49% in Oct, up from 44% in Sep, above 45% expected. However, new buyer enquiry was down from 18 to 12, a low since April. The price increases may in part reflect tighter stocks with the sales-to-stock ratio rising to 39.9% a high for the year, even as the number of sales eased from 18.7 to 18.5. The RICS economist said, “The legacy of the drop in new build following the onset of the global financial crisis is now really hitting home.”… “It is hard to get away from the issue of supply when it comes to the current state of the housing market.”
- UK employment rose 177K 3m/3m in Sep, above 120K expected, up from 140K the previous month, a high since March. The unemployment rate fell to 5.3% in the three months to Sep, down from 5.4% in the previous month and stronger than 5.4% expected, a new low since 2008.
- However, UK wage growth was 3.0% 3mth-yoy in Sep, below 3.2% expected, and unchanged from Aug. An underlying measure, private sector excluding bonuses slowed from 3.3% to 3.2%. On balance the labour data were seen as bullish for the GBP and rates with the tightening labour market trumping the set-back in wage growth.