AUD – what gives? – risks and strengths
The AUD faces a number of downside risks; these include a weakening housing market, a persistent jump in Australian bank funding costs, tightening credit conditions for Australian borrowers, tightening shadow-finance in China, a slowing Chinese economy, and threats related to a trade war between the US and China. However, to date, China is managing its economy and financial sector to prevent more than a gradual slowing in activity. Chinese steel production growth remains solid and Australian commodity prices are holding above their average for the last two years. Australia is taking a bigger share of Chinese iron ore imports, and its material sector is being supported by a combination of a weaker AUD and stable commodity prices. Australia’s external balance appears structurally stronger. Private business investment is growing solidly, supported by infrastructure demand, as the mining investment downturn tapers out. Overall business conditions have ebbed in recent months but remain well above average. Consumer confidence has lifted to moderately above average, showing little fallout, yet, from a weaker housing market. We expect the AUD/USD to be hemmed into a 70/75 range with a bias to expect further falls.
Some peaking in Australian employment lead indicators, but still solid
At the margin, the dip in the NAB monthly business survey employment component, flattening in job ads, and the lower trend employment growth in recent months might suggest some risk of a weaker than expected employment report for June, released on Thursday.
However, in the broader context, the labour market appears robust and we cannot read too much into the modest decline in these leading indicators.
The NAB business survey labour component has weakened from around 12 earlier in the year to a recent low of 5 in June. However, this is still a solid result, and the drop may be noise, so we shouldn’t read too much into this.

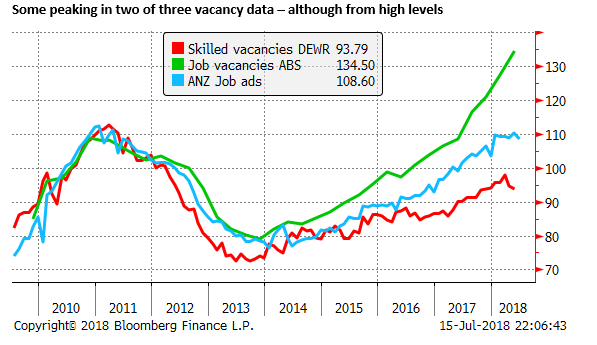
Vacancy data is sending mixed signals. The ANZ job adds series has been flat from Jan to Jun, albeit around the highs since 2011.
Similarly, the skilled vacancy series from the Government Department of Employment and Workplace Relations (DEWR) has dipped in April and May from a high in March, although it remains up on year-ago levels, around the high since 2012.
On the other hand, the Australian Bureau of Statistics broader vacancy series rose strongly in the last two quarters to May; a record high.
Job growth has slowed this year
The pace of job growth has slowed from around 35K in the second half of last year, to around 12K in recent months.
Most of the slowdown has occurred in full-time jobs; down from around 30K in the second half of last year to be around flat in recent months.
The market is looking for a bit a rebound in the data for June on Thursday from recent low job growth outcomes; the median prediction for job gains is 16.5K. The data is notoriously hard to predict and the range of expectations is from +5K to +30K.

Unemployment has remained relatively stable – slack remains, especially in under-utilization rates
In the May labour report, released last month, the unemployment rate fell from 5.6% to 5.4%, the low side of its range since September last year. However, the under-employment rate, released quarterly, mid-quarter, ticked up from 8.4% in Feb to 8.5% in May.
The RBA tends to see the full employment rate of unemployment at around 5.0%. The unemployment rate is modestly above this level, suggesting that there is some, but not all that much slack in the labour market. However, the underemployment rate has remained relatively stable for the last four years at around its record high, suggesting there may still be significant slack in the labour market.

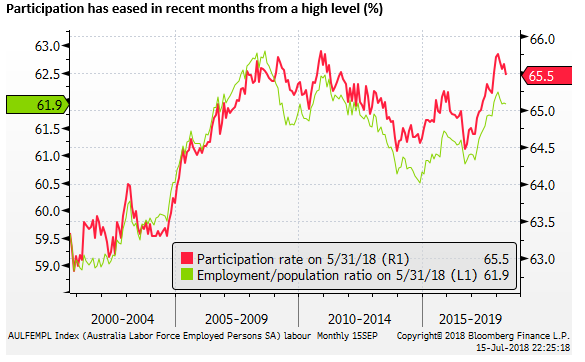
Contributing to the slack in the labour market has been an increase in the participation rate over the last 18 months to around record levels last seen in 2010. However, participation has ebbed from its high in January this year, keeping the unemployment rate relatively stable this year, despite the slowing in monthly job gains.
A recent improvement in the AUD carry
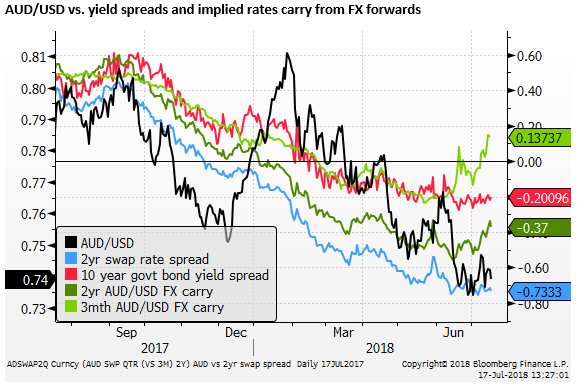
The AUD, like many currencies, is lower reflecting higher interest rates in the US. The Australian government and domestic swap rate curves are entirely below those in the USA out to at least 10 years.
The 2-year AUD yield advantage is at the lows since 2000, and perhaps at the low on record for 10-year yields. This might alone argue for the AUD/USD to fall towards 0.65.
However, there may be other underlying fundamentals that appear to make the AUD stronger and the USD weaker in comparisons across decades. The Australian current account appears structurally narrower (discussed further below) and the US fiscal balance and government debt are significantly worse.
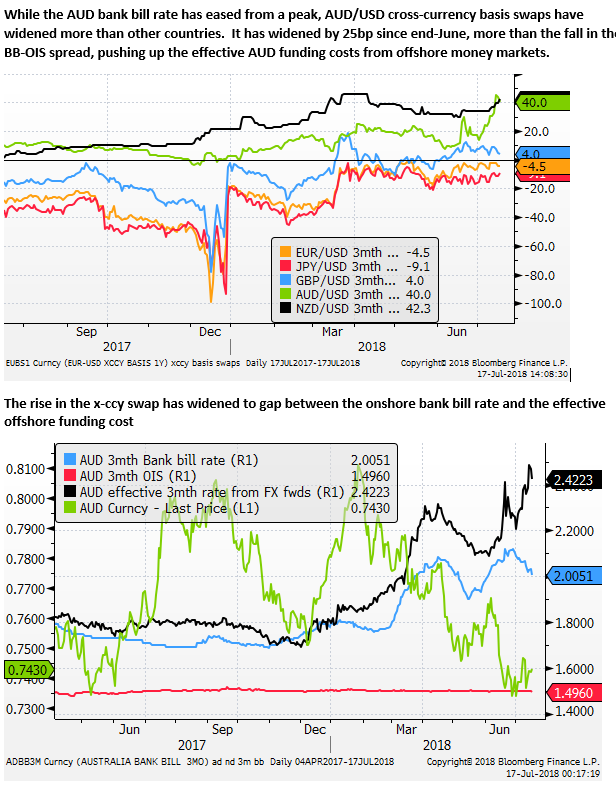
Narrowing our focus to more recent developments, one consequence of the tightening in AUD funding costs in the recent months (discussed further below) is that the AUD/USD cross currency basis swaps have risen sharply and have increased the carry return from the AUD.
On one level, this may point to economic risks that are negative for the AUD, but it may also provide some support for the AUD. Despite lower interest rates in Australia, the effective 3mth rate in the FX market calculated from AUD/USD forwards have moved above 3mth USD LIBOR.
Commodity prices remain stable above levels over recent years
The chart below shows overall Australian commodity prices have recovered significantly since their lows in 2015 and remain above the average over the last two years, providing support for the AUD.
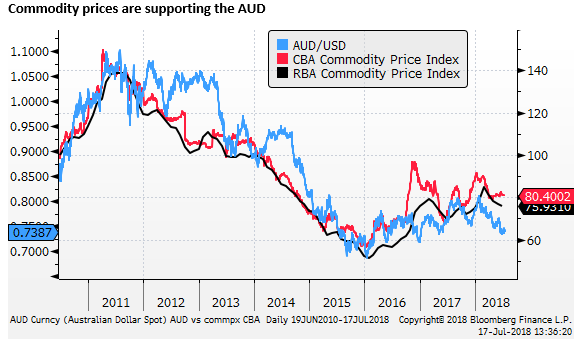
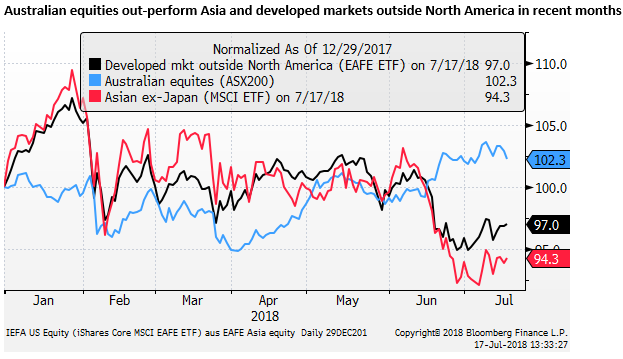
The support from commodities is apparent in the equity market, with the materials and energy sector contributing to stronger equities.
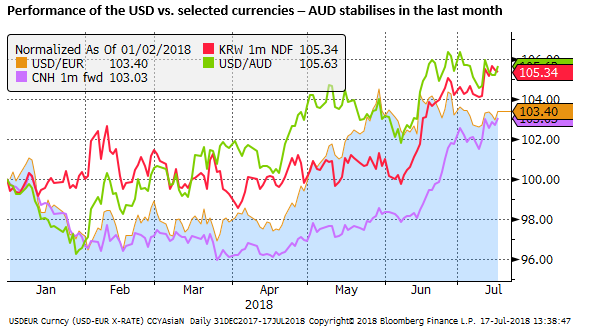
AUD dragged down by a weaker CNY, but more stable in recent weeks
The fall in the AUD in recent months is consistent with a decline in the CNY, other Asian currencies and equities. However, in the last month, the AUD has held relatively steady, out-performing the further decline in some Asian currencies.
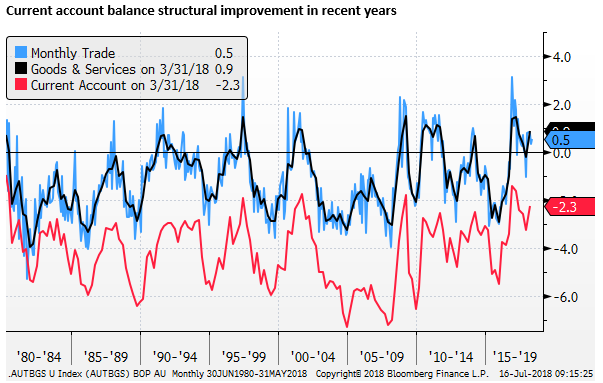
Australian current account improvement
Firmer commodity prices in recent years, increasing export volumes, and slowing capital goods imports as mining investment winds down has contributed to a structural improvement in Australia’s external balance
Historically its current account deficit has been typically in a range of 3 to 6% of GDP. In Q1 this year it was 2.3% of GDP and has averaged around this level for the last year and a half.
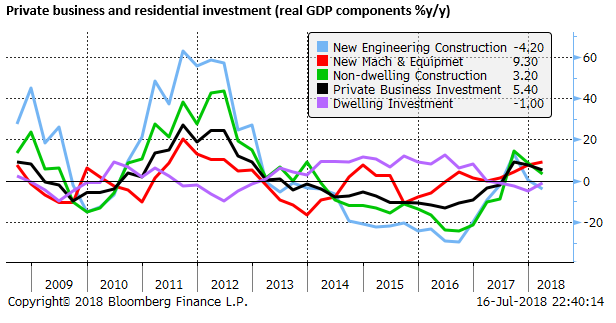
Private business investment recovery
A mining investment downturn was a big drag on the economy from 2014 to 2017. This drag has almost finished. Non-mining investment is now picking up solidly. It is being supported by government infrastructure investment contracted out to private companies. There is also strength in the service sector including tourism, education and health services that are supporting non-mining business investment.
Strong population growth over the last decade running around 1.5% pa, driven by rapid immigration, has boosted demand for infrastructure, housing and services in the economy, underpinning investment spending.
During the mining investment bust, strong housing construction helped support overall investment spending and prevent a deeper economic downturn. Housing investment has now levelled off and maybe a small drag on growth, but it is expected to remain relatively stable at a high level.
The RBA is anticipating that business investment will be a key contributor to its forecast of above-trend growth over the next two years.
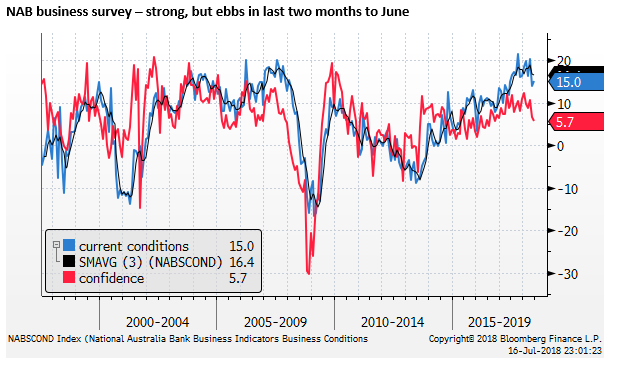
Business surveys above average, but down in the last two months
The RBA forecast for ongoing strong business investment is supported by relatively strong business survey data. The closely watched NAB monthly business survey has shown current conditions have been around record highs since October last year; last seen in 2007. However, they have dipped somewhat in the last two months to June.
Confidence has never risen to the same heights as conditions. It too has fallen in the last two months to be now around its long-run average.
The modest ebbing in conditions and confidence bears watching, but at this stage, there are no clear signs of moderation in the Australian economy.
Chinese demand for Australian commodities stable
Chinese credit and economic reports released earlier this week show a moderation in growth. However, it remains gradual, and it seems that the government is succeeding so far in controlling the downturn and maintain GDP growth at or above its target of 6.5% for the year.
There is a risk that growth slows further as the year progresses, and confidence may be hit if the trade war with the US escalates as many fear. However, the June data continued to show that Chinese steel production, crucial for Australian commodity exports, remains solid, up 6.7%y/y.
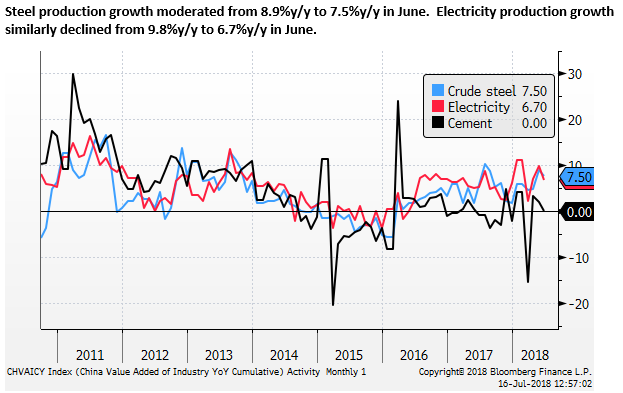
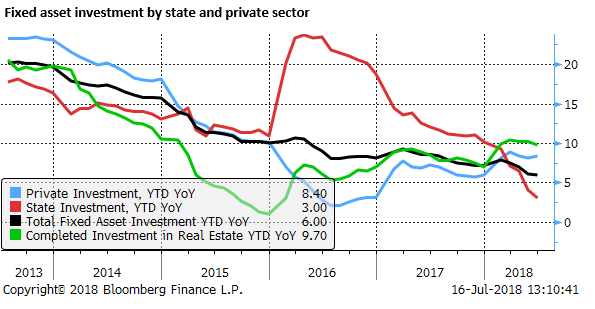
This may be surprising in light of the slowdown in infrastructure spending, but it appears to have been underpinned by real estate investment.
The fall in fixed asset investment has been concentrated in the government (state) sector (down from 4.1% to 3.1% in June ytd-yoy). This is led by weaker infrastructure spending. While private investment has been stable above levels seen last year (up from 8.1 to 8.4% ytd-yoy in June).
The RBA 3 July policy minutes said, “Infrastructure investment had weakened, which was likely in part to have reflected ongoing efforts to reform local government finances. Members noted that infrastructure investment activity could recover in coming months, given that many local authorities still have capacity to issue more bonds.”
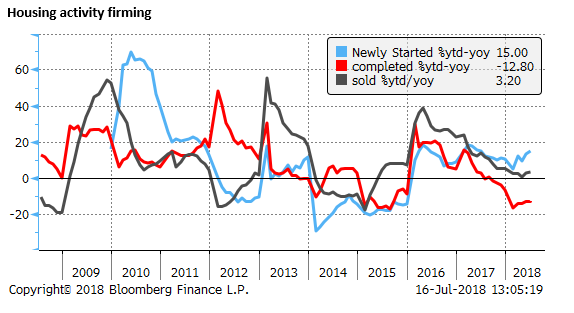
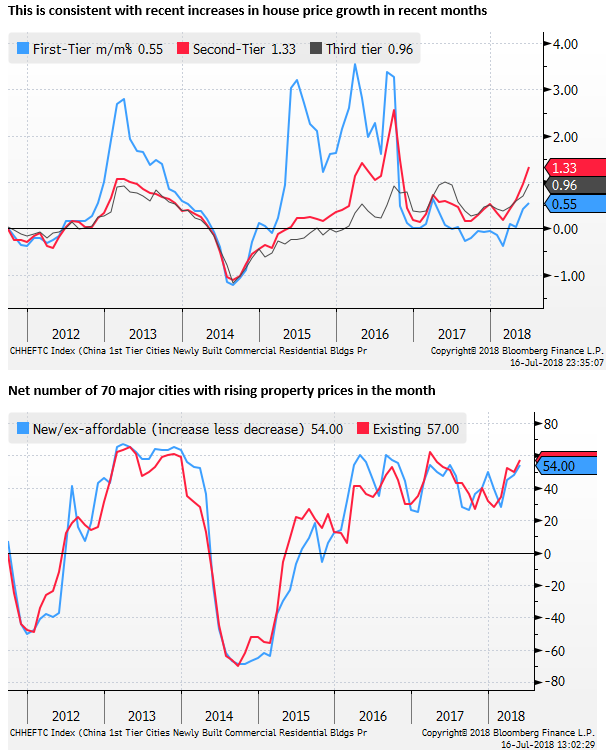
Chinese housing market firming again
Chinese housing activity firmed; sales rose from 2.3% to 3.2% ytd-yoy in June. New starts rose from 13.2% to 15.0% ytd-yoy.
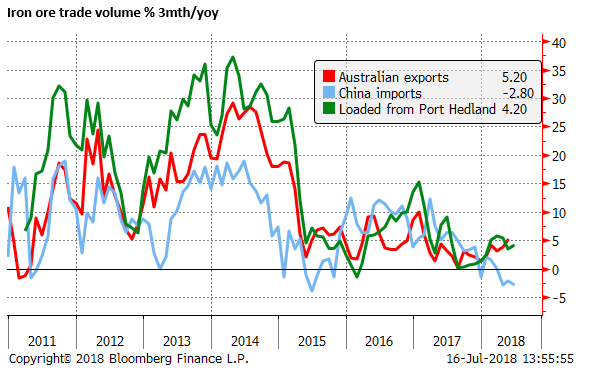
Chinese iron ore imports decline, but Australia takes a bigger share
The volume of Chinese imports of iron ore has eased this year (-2.8% 3mth-yoy in June). However, Australia appears to be taking more market share, with its exports of iron ore up 5.2% 3mth-yoy in May, and iron ore loaded from Port Hedland up 4.2% 3mth-yoy in June.
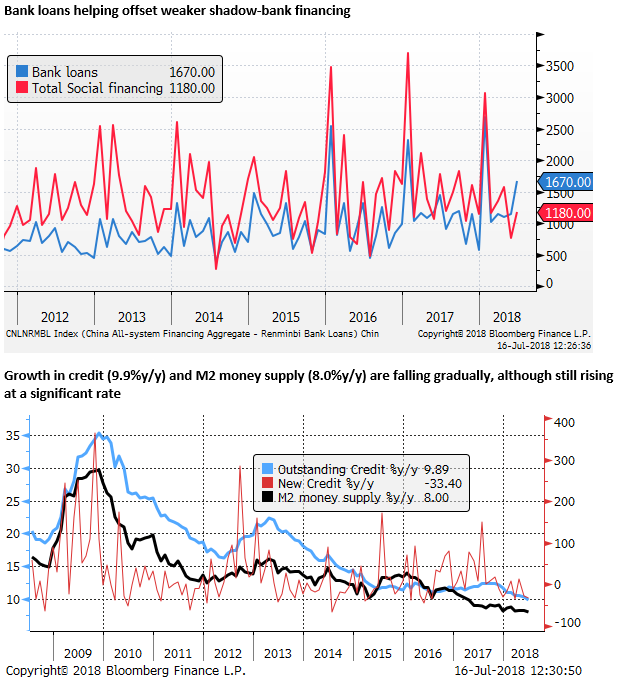
Chinese credit growth slowing, but only gradually
Credit growth in China is showing the effects of a crackdown on shadow finance. However, bank lending has increased, helping take up the slack and prevent a deeper fall in credit growth. Policymakers have cut the RRR twice this year (April and July) and market-market rates have fallen, helping underpin credit growth.
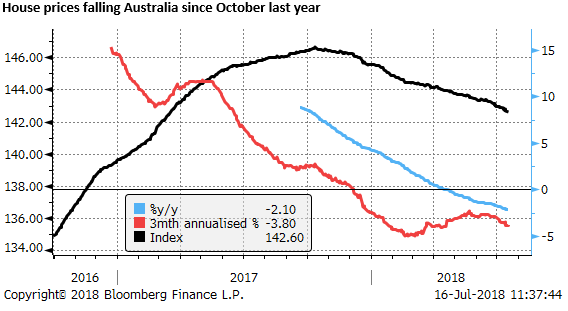
Housing market decline a risk for the AUD
National price indices are falling since around October last year. Press articles are reporting increasing bearishness by a number on analysists that expect a more prolonged period of falling house prices.
A key contributor to the slowdown is tightening in credit conditions in recent years on increasing regulatory scrutiny on bank lending activities; including coming from the Hayne Royal Commission into Financial Services. Banks are thought to be moving ahead of the Hayne RC and applying more conservative lending standards is determining how much households can borrow.
House prices on average across capital sectors have been falling at a 3.8% pa rate over the last three months, and are down 2.1% from a year earlier (calculated from the CoreLogic 5 capital city hedonic daily price index).

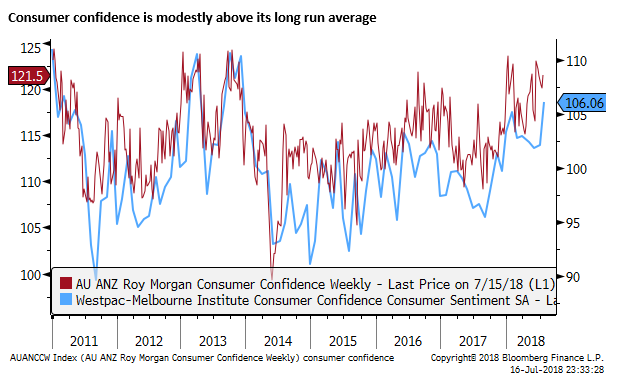
Consumer confidence holding firm
This threatens to undermine household confidence and reduce spending. However, this is little evidence that households confidence has been affected. The rate of decline in house prices may not be alarming households, especially coming off several years of rapid price gains. Consumer confidence may be underpinned by an improving job market.
Perhaps a more prolonged period of falling house prices or a faster pace of decline could undermine consumer confidence.
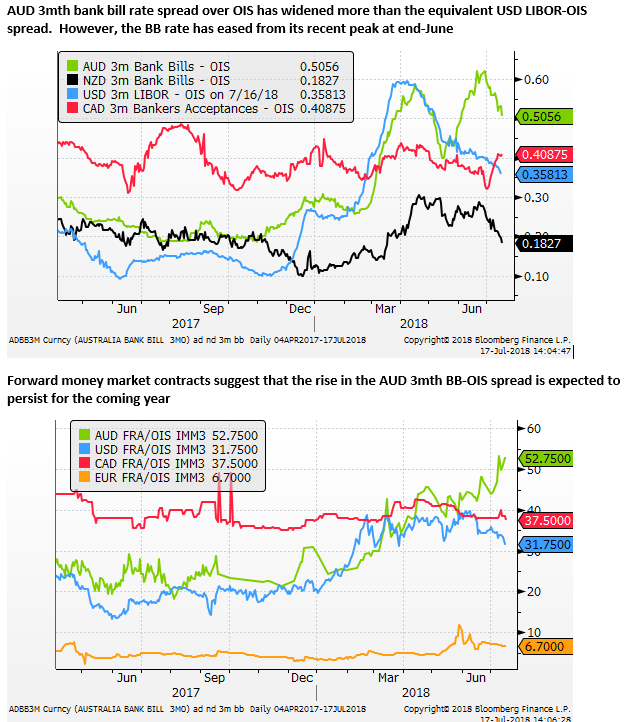
Australian bank funding costs more elevated
A curious development is a significant rise in Australian bank funding costs. Initially, this was thought to be largely related to tighter funding for the USD in global markets that has been blamed on tax reform in the US, causing repatriation of US multinational earnings, and more onshore borrowing by foreign multinational companies operations in the USA.
However, there is something more worrying going on with Australian bank funding costs rising further even as USD dollar funding costs have eased from a peak in April. The perception is that this is going to persist in Australia for some time.
This raises questions about why Australian banks are facing such a persistent squeeze in funding. It may reveal an underlying vulnerability in the Australian financial sector.
It may be symptomatic of tightening liquidity globally, and Australia’s relatively high level of household debt.
Smaller banks and lenders have raised rates for mortgage borrowers, and this is expected to spread to the major bank lenders soon.
This risks further tightening credit availability in Australia, and somewhat higher borrowing costs that may add to the slowdown in the housing market and weaken consumer spending.
The market presumes that the higher funding costs will delay RBA rate hikes for longer. However, it’s not clear that this should directly undermine the AUD since the higher funding costs are also improving the carry return from long AUD positions. In effect, they are delivering higher effective interest rates in Australia, for both borrowers in Australia, and buyers of the AUD.