Australian employment data present upside risk for the AUD
The Chinese trade and industrial activity data are consistent with weaker steel sector assets and commodity prices and this may contribute to further medium term weakness in the AUD. However, the Australian employment data represents a short term upside risk for the currency with recent activity indicators solid and scope for this data to significantly surprise on the topside.
Market not fully prepared for ECB or Fed
The chart below of Euro money market rates indicates that they have fallen significantly since the ECB warned at its last policy meeting on 22 October that it was considering easing policy further at its 3 December policy meeting. And they fell further after a Reuters article on Monday suggested a cut in the policy rate is the least contentious part of the decision and the debate was more about the size of the likely cut.
Prior to the last ECB meeting cash rates were around -14bp; 5 to 7bp above the current effective floor rate of -20bp. Projecting forward from overnight interest rate swaps, they are now expected to be trading around -24.5bp in a few months, suggesting the market is basically pricing in a 10bp cut in the floor cash rate at the next policy meeting to -30bp. In our view, the risk is that the ECB cuts deeper than this, putting further downward pressure on money market rates and yields across the curve.
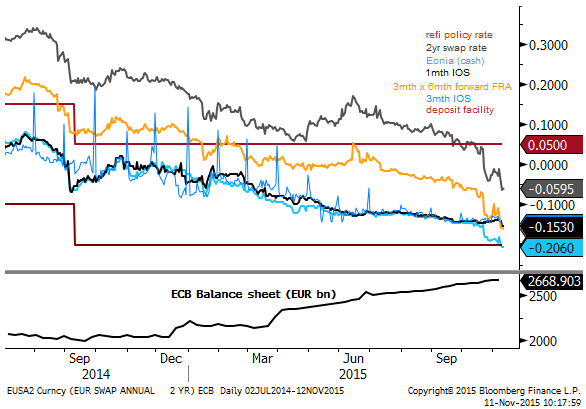
Source: Bloomberg, AmpGFX
Furthermore, across the Atlantic, the market is still not fully pricing in a hike in USA rates at the 16-Dec meeting, even though all the ducks look fully lined up. It appears to be less than 70% priced in by my calculation, suggesting that the market is fearing global market upheaval may again delay the hike. It may be that a surge in the USD itself undermines the chances of a hike.
As it stands, it appears that policy decisions in December are likely to result in further interest rate support for the USD, particularly against the EUR.
The yield disadvantage of the EUR, the large outright cost of holding safe assets in the EUR, and opportunity cost of not hedging out of EUR asset currency exposure, suggests that unless we are in a constant state of financial markets upheaval, a EUR/USD down-trend may persist for some time.
Australian activity indicators point to solid employment data
We have been expressing a negative view for the AUD on the basis that the weakening trend in its key commodity prices will persist as demand slows in China. The RBA has raised its risk assessment of China and has said that if there were to be a change in rates in the near term it would be a cut. The data this week in China for trade and industrial production only support this view.
However, there are signs that Australian domestic economic activity supported by non-resource sectors have come to life.
Employment growth was 2.0%y/y in Sep, its fastest rate since May-2011 and the unemployment rate has been relatively stable over the last year at around 6.2%.
The pick-up in employment growth over the last year is consistent with a recovery in business surveys. The NAB monthly business survey showed conditions steady at +9 in Oct, modestly above its long run average of around +5. The employment component was steady at +3, above its long run average of around zero.
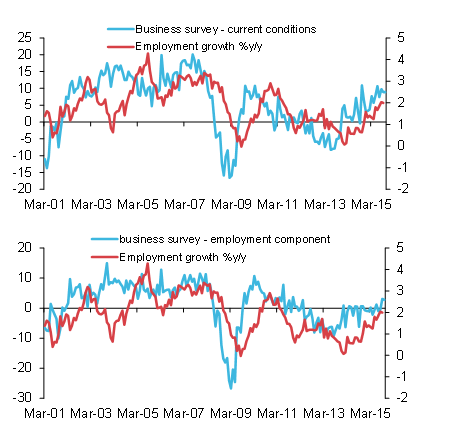
Source: Bloomberg, AmpGFX
The PMI’s for services, manufacturing and construction are also showing overall improvement in the economy. A three month average across these three indices was 52.1 in October, a high since 2010. This might also support confidence in employment growth.
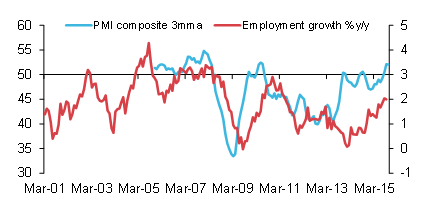
Source: Bloomberg, AmpGFX
The job vacancy data has also been trending up for the last year. ANZ internet job ads were up 12.9%y/y in October.
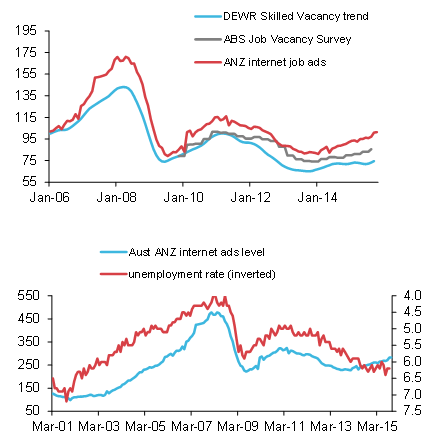
Source: Bloomberg, AmpGFX
Given the momentum in these survey data on activity and job ads, it is prudent to prepare for a stronger than expected labour data tomorrow. The market expectation for a 15K job gain is not remarkable, slightly below the three-, six and 12-month averages (17.5K, 15.1K, and 19.2K respectively). And the unemployment rate is expected to remain stable at 6.2%, where it has averaged for the last year.
In the news
- Political upheaval in Portugal: Parliament rejected PM Coelho’s fiscally conservative government program. President Aníbal Cavaco Silva is expected to appoint António Costa, the Socialist party (PS) leader, to form a government. (Socialists set for power in Portugal as left topples government – FT.com)
- Reuters reported on Monday that several ECB members had told them the ECB was preparing a significant expansion of its policy easing, a rate cut was the least contentious part of that decision, and some wanted a larger cut than 0.10ppt. The report said, “Three of the ECB policymakers said debate is now about the size of the rate cut with some arguing that a 0.1 percent reduction, already priced in by markets, would have little impact.” And, “Two policymakers said the bank should go for a bolder move, in line with its recent tradition of delivering policy moves in excess of expectations.”… Two of the Governing Council members said there was no doubt that the ECB would act in December because inflation is still close to zero while a third one said the deposit rate cut was the least contentious proposal on the table.” (Exclusive: ECB rate setters converge on December deposit rate cut – Reuters.com)
- The Indian government announced it had raised foreign investment limits in 15 industries on Tuesday. Seen as a bid to regain reform momentum after the ruling party lost in a state election on the weekend. (FDI reforms: Modi Govt opens up 15 sectors – indiatoday.in) (India Eases Retailer Requirements, Lifts Some Foreign Investment Limits – WSJ.com)
- El Nino indicators strengthening putting upward price pressure on agricultural commodity prices. (El Niño Heats Up as Indicators Suggest One of the Worst Years – WSJ.com).
- FT reports: In its annual outlook, the International Energy Agency said oil demand would rise by less than 1 per cent a year between now and 2020, slower than necessary to quickly mop up an oil glut that has driven prices to multiyear lows. (Oil glut to swamp demand until 2020 – FT.com)
Economic news
- Australia: consumer confidence rose from 97.8 in Oct to 101.7 in Nov, above the 100 neutral level between positive and negative responses, further lift in from a recent low of 93.4 in Sep. At the high end of its range for last year and a half or so, but still somewhat below the long run average in the 105 to 110 zone.
- Australia: Business survey – Conditions steady at +9 in Oct, around the highs since 2010, above the long run average around +5. Confidence slipped from +5 to +2, to a little below the long run average.
- Employment component steady at +3, around the highs since 2011, just above the long run average of +1. Profitability fell from 9 to 8, around the highs since 2009, above the long run average of +3.
- Labour costs rose 0.3%q/q, the 3-, 6-, 12-month averages are at the lows since 2009, and well below the pre-2008 crisis levels.
- Capacity utilization firmed from 81.3 to 81.4%, the high since 2011, around its long run average
- Forward orders fell from +3 to -2, to a low since Sep-14. The three-month average was +2, a little above the long run average of zero.
- Australia: housing finance approvals number rose 2.0%m/m in Sep, but were revised down from +2.9% to 1.5%m/m in Aug, close to expected. The value of Investment lending fell 8.5%m/m, the weakest month since Aug. A sign that investor demand is waning, consistent with tighter lending standards and the perceptions the housing market may be cooling.
- New Zealand: REINZ housing sales cooled from a strong 38.3%y/y in Sep to 18.6%y/y in Oct and the median house price gain slowed from +15.4%y/y in Sep to +7.0%y/y in Oct. The data suggest new measures requiring foreign investors to acquire a tax file number and approaching new limits on high-LVR loans to investors due to begin in November may be starting to dampen the hot Auckland property market.
- China: CPI rose 1.3%y/y, below 1.5%y/y expected. The non-food index fell from +1.0% to +0.9%y/y to a low since April.
- Philippines goods exports fell 24.7% in Sep, well below -8.3% expected, down from -6.3%y/y in Aug, the weakest growth since 2011. Manufactured goods exports fell 23.6%y/y, down from +0.4%yy. In Aug
- Korean export price index fell 6.2%y/y in Oct, down from -2.1%y/y in Aug, revised down from -1.9%y/y, a low since March. Its import price index was down 14.8%y/y.