Australian Govt infrastructure boom is leading private capex recovery
Q2 Australian construction work done surged on Wednesday by a record. While lumpy work at an LNG project drove this increase, the data also showed strong growth in public infrastructure spending. The capital expenditure survey increased for the year ahead by the biggest margin since the mining boom; this time led by the service sector. The CEO of a major building materials company predicted that Australia’s infrastructure boom (now underway) would last up to 10 years and deliver bigger profit momentum than the housing boom. New Zealand house price inflation fell to a five-year low. Australian yields, particularly at the long end of the curve, have risen significantly relative to US yields. The rise in relative yields and commodity prices fully explains the recent resurgence in the AUD/NZD. However, it is still low relative to its long run average. Current economic trends and external balances suggest it can continue to rise.
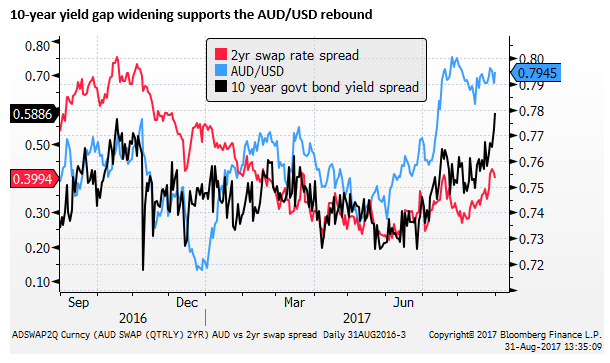
Widening gap in AUD/USD yield advantage
US 10 year yields are still trending lower, weakening the long term yield advantage of the USD against many currencies. The US 10-year benchmark yield is trading below the previous low for the year in June.
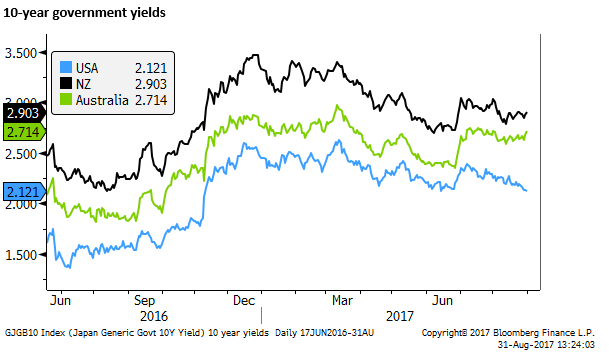
The AUD/USD yield advantage has improved across the yield curve, but more at the long end. This widening AUD/USD at the long end of the curve mostly reflects a widening the real yield gap rather than higher inflation expectations in Australia; the 10-year breakeven inflation compensation for both the USA and Australia have been stable.
New Zealand housing market retreat
The New Zealand QV house price inflation measure continued its sharp decline falling from 6.4% in July to 4.8% 3mth-yoy in August; a five year low.

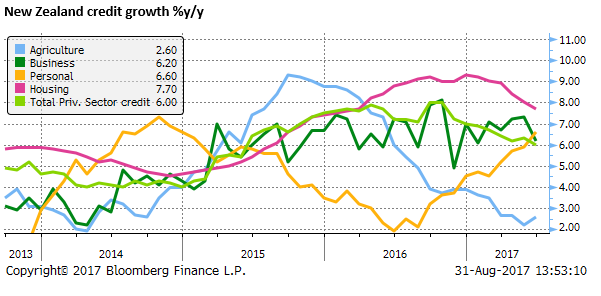
New Zealand credit growth slows
New Zealand credit for housing also continued to slow to 7.1%y/y in July; a low since Oct-2015. It has annualized at around 6% over the last six months. However, credit for personal spending (a relatively small component of overall credit) rose 6.9%y/y, a high since 2014.
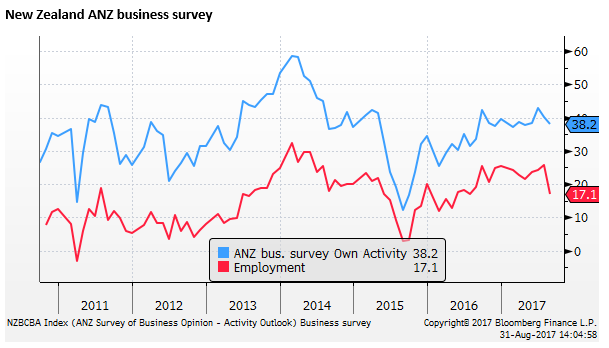
New Zealand business confidence stable
The ANZ business survey own-activity index ebbed a bit in the last two months to August; although ANZ said this is seasonal, and the index remains steady at a solid level. The employment component ebbed more significantly.
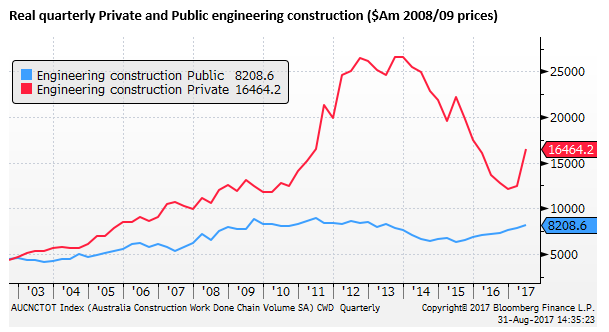
Australian engineering construction surges
The Q2 construction work done index, released on Wednesday, surged 9.3%q/q (the biggest rise on record), led by engineering, related probably to completions in LNG projects. This data is used for measuring GDP in Australia rather than the associated building components of the capex survey; it may help lift GDP forecasts, although there is likely to be offsetting falls in imports or inventories.
More positive for the medium term outlook is solid stable growth under-way in public engineering; up 15%y/y in Q2, a high since 2008. Government infrastructure projects are contributing to solidly to stronger growth.
The CEO of Boral, one of Australia largest building material company, Mike Kane, said he expects Australia’s infrastructure boom to last up to 10 years and deliver bigger profit momentum than the housing boom, which is slowly easing but will still stay well above long-term averages.
“The infrastructure boom is on us right now,” he said on Wednesday, highlighting that concrete prices rose between 3 per cent and 5 per cent in most metropolitan markets in 2016-17, except in the weaker West Australian economy.
Boral CEO says infrastructure boom will be bigger than housing – AFR
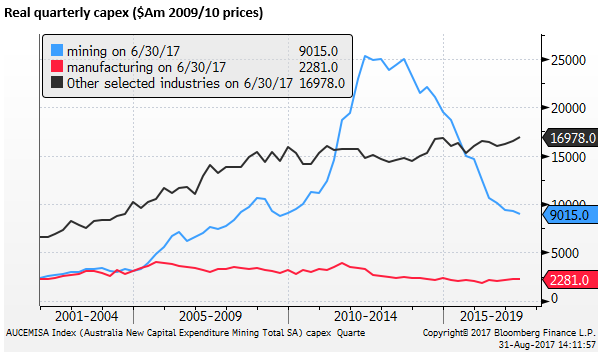
Australian capital expenditure solid in H1
The Australian Capex business survey showed a solid 0.8%q/q gain in Q2 (above 0.2% expected), and Q1 was revised up from 0.3% to 0.9%q/q. The gains reflect stronger non-mining investment coming in the largest and most important ‘other industries’ (services).
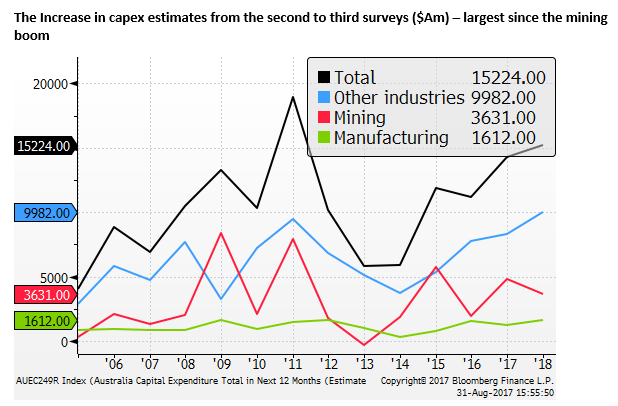
Survey for coming year jumps by most since mining investment boom
The capital expenditure survey, includes estimates for the current fiscal year ended June-2018. It is hard to interpret this data without torturing it to near death. But most analysists have viewed the jump from the second to the third estimate as a significant improvement. The third estimate was up 17.6% from the second estimate, which does sound like a lot, but there tend to be significant upward revisions in this data. It is also true that the third estimate is down 3.6% from the same estimate a year earlier.
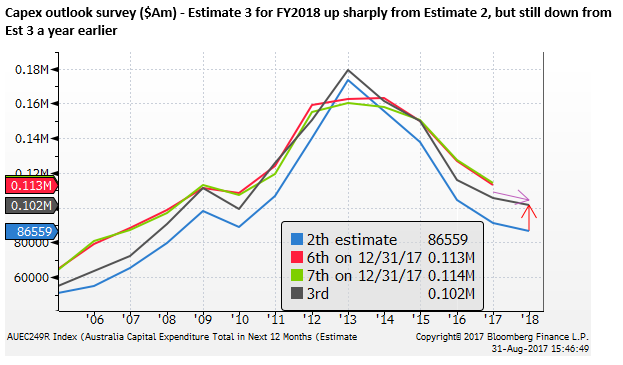
However, the jump in the second estimate to the third estimate for the 2018FY is the largest since the height of the mining boom. And it is the largest for other industries (services) on record. So this represents a significant upward revision from the previous survey; a reason to see the RBA and government lift their GDP growth forecasts.
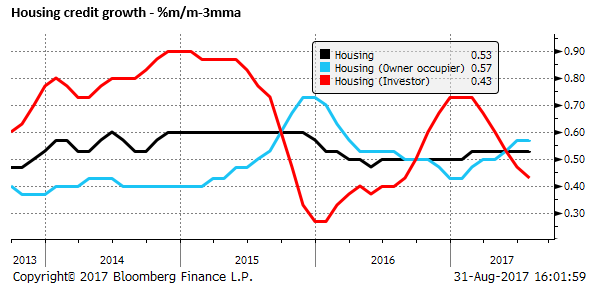
Australian housing credit growth steady, business credit growth strengthens
Australian credit growth data showed further slowing in lending for housing investment, consistent with macroprudential measures targeting this sector. But this continues to be largely offset by firmer lending for owner-occupiers, such that total housing credit growth continues at a stable moderate rate (6.6%y/y). Consequently, household debt to income ratios continues to creep higher approaching 200%.
Business credit growth tends to be more volatile; after falling in Q1, it is rising in the last three months to July at around a 6% annual rate, up 4.2%y/y.