Australian labour and wages indicators point lower ahead of key data next week
The RBA essentially made a case to cut rates on Tuesday this week. However, it held back, perhaps influenced by the timing of the election (18 May), to give the labour market data a chance to show that it is on a tightening trend.
This places much importance on the labour market data for April (16 May) and wages data for Q1 (15 May) due next week in Australia. One month’s data may not be enough to clear the way to cut, especially after solid employment growth in Q1, but the RBA may not need all that much encouragement. Even modest weakness in the data may raise expectations of a cut in June (currently at 30% probability).
PMI data for Australia released in recent weeks had very weak employment and wages components and suggests there is a risk towards soft labour data next week.
The forecasts alluded to in the RBA policy statement on Tuesday implied that the RBA would need to cut rates soon. The quarterly Statement on Monetary Policy released later today may further emphasise a bias to cut rates.
The RBNZ rate cut this week confirmed that it has become more proactive than the RBA. It appears to be getting ahead of the curve, while the RBA risks falling behind the curve.
There is considerable scope for a hit to global high-beta assets if the Trump administration moves to raise tariffs. There may be only a modest recovery in risk appetite if the US-China trade talks are extended. The longer the talks drag on, the more delayed a possible global economic recovery, the greater the risk that the market loses confidence in global asset markets.
RBNZ more proactive than RBA
The RBNZ has acted more proactively than the RBA, moving to cut rates even though it is much closer to meeting its inflation target than the RBA, and has a relatively stable housing market. Both countries have experienced weaker activity indicators in the last six months or so, but have solid labour markets; albeit with subdued wage growth.
The rate cut in NZ feels more like an insurance cut, and there does not appear to plan for a follow-up cut for the time being.
If the RBA cuts, as seems highly likely in coming meetings, it will probably feel like the first of two cuts as it is forced to face up to significantly undershooting its inflation target and the drag from its housing market on construction and household spending. The longer it delays action, it may appear to be slipping behind the curve.
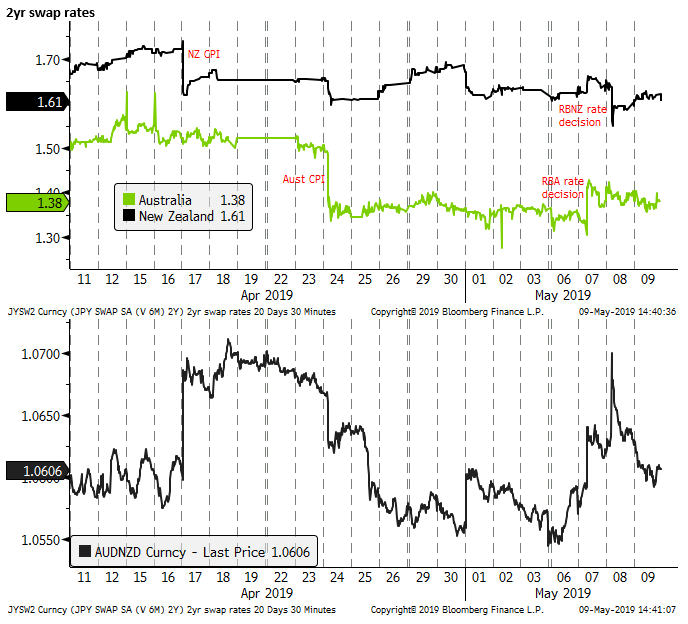
The RBNZ rate projections were for rates to fall 10 bp further to a low of 1.36%, in the second half of next year, before rising again in 2021, suggesting there is around a 40 to 50% probability of another rate cut. The fall in the NZD was relatively modest after the RBNZ rate decision, reflecting this relatively optimistic scenario that deeper cuts may not be needed at this stage.
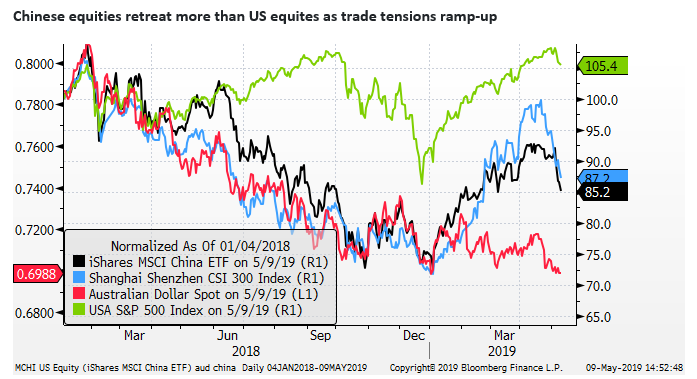
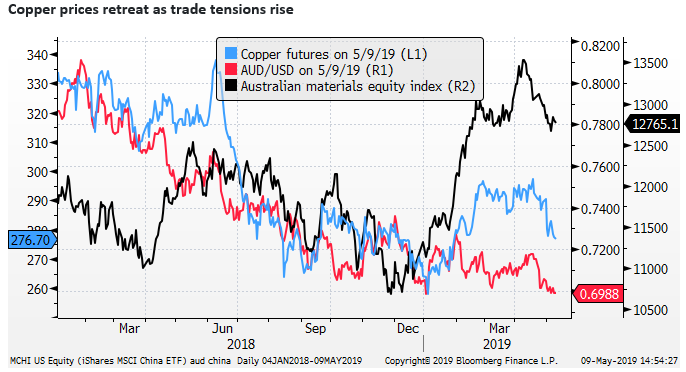
Trade talks keep the market on edge
The ongoing trade dispute between the US and China and brewing trade tensions between the US and the Eurozone pose a threat to global asset markets and the global economy. Global trade and industrial activity remain sluggish after growth fell sharply late last year and into early this year. Equity markets have arguably factored in a US-China trade deal that remains elusive.
If the US administration decides not to impose higher tariffs, as threatened this week, and says that they are seeing progress in trade negotiations with China, there may be a tentative relief rally in global asset markets towards end week or early next week.
However, the uncertainty over a trade deal may seem to increase if the trade talks drag on from here, signalling difficulty in closing a deal, and raising the risk of more US administration threats of higher and broader tariffs.
With the US also in trade negotiations with Japan and Europe, and USMCA yet to be passed by Congress, trade tensions may seem to become a constant pall over the global economy.
Uncertainty remains high, and the risk of serious disruption to supply chains has increased. This has trimmed global business investment and trade flows since last year. An escalation of trade tensions may prolong the dampening of global activity. In the worst case scenario where a trade deal falls apart, and tariffs are extended and increased, global growth confidence and asset market could fall sharply.
If the renewed tensions dissipate quickly and a trade deal is forthcoming within weeks, asset markets may resume their improving trend this year, but the upside potential is probably not as large as the possible fall in asset markets if tariffs appear set to be ramped up.

Australian employment data may pressure AUD lower
The prospect of rate cuts soon in Australia should keep the AUD heavy. The key focus for the market will be the employment data since the RBA said, “…. further improvement in the labour market was likely to be needed for inflation to be consistent with the target. Given this assessment, the Board will be paying close attention to developments in the labour market at its upcoming meetings.”
Wages data will also be of high importance. The RBA said, “The strong employment growth over the past year or so has led to some pick-up in wages growth, which is a welcome development. Some further lift in wages growth is expected, although this is likely to be a gradual process.”
Key to the RBA assessment that the economy grows around trend is that rising employment and wages growth boosts income growth. The RBA said, “The main domestic uncertainty continues to be the outlook for household consumption, which is being affected by a protracted period of low income growth and declining housing prices.”
As such, the Q1 wages data (15 May) and April labour data (16 May) next week can have a big impact on the outlook for RBA policy and the AUD.
The RBA said, “The Australian labour market remains strong. There has been a significant increase in employment, the vacancy rate remains high and there are reports of skills shortages in some areas.”
However, there are a number of indicators that suggest momentum in the labour market has slowed, and the risk is that this shows up in the labour data sooner or later; and possibly next week.
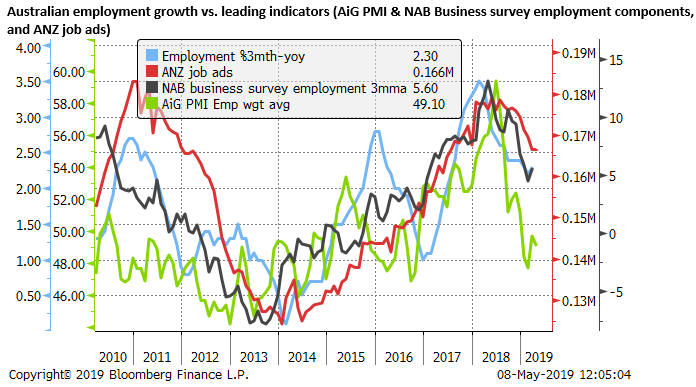
The AiG PMI data released over the last two weeks show that business activity has slowed. More specifically the employment components were weak in April.
All three AiG sector PMIs showed falls in their employment components in April. A weighted average of the three fell to 45.7 a low since August-2016. A three month average of this composite employment indicator was at 49.1 in April, down from a peak of 59.4 in June last year.

The NAB business survey for April is also due next week (12 May). The employment component peaked in Feb last year at 15.5, falling to a recent low in December of 3.4, edging back up to 6.6 in March. It might be consistent with moderate trend growth in employment, but it is significantly weaker over the last six months.
ANZ job ads fell slightly in Apil by -0.1%m/m, the sixth fall in a row, peaking in May last year, down 5.6%y/y.
The peaking in theses employment indicators is consistent with a moderation in the pace of job creation from a very high 3.5% annual rate in Q1 2018 to a still strong 2.3% in Q1 this year.
The direction of change in business survey employment components and job ads suggests that employment growth should slow further.
The RBA has concentrated its public comments on vacancy data. It said, “the vacancy rate remains high and there are reports of skills shortages in some areas.” The quarterly vacancy data (last released for February) rose to a new peak, and indeed is the strongest of the labour market indicators.
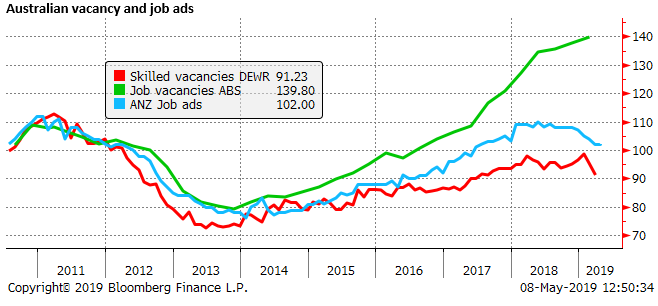
While job ads have declined, their level might still be consistent with solid job creation. As such, the labour market could continue to print solid growth and declining unemployment.
It is difficult to judge how the rate of employment growth will affect the unemployment rate and wage growth. Labour force growth was 1.8%y/y in Q1, and population growth is thought to be around 1.5% per year. Employment growth running at 2.3%y/y in Q1 (24.5K per month) does appear to be fast enough over the last year to result in a falling trend in the unemployment rate. As such the RBA has remained upbeat of the labour market.

It will be hard to draw conclusions from one month’s data in a volatile series. The recent rate of growth appears solid. However, the falling trend in business surveys and job ads suggests that it may slow from here. On the other hand, the high level of vacancies and job ads may point to still solid employment growth.
We noted in our assessment of the RBA policy statement that it largely made the case to ease policy. Its decision not to cut appeared to be influenced by the timing of the national election. As such, it may not take much weakness in the labour data to trigger a rate cut. No real change in the labour market data over several months might be sufficient to move the RBA to cut.
Wages data may also weigh into the RBA rate decision. Growth in wages is also an indicator of tightness in the labour market.
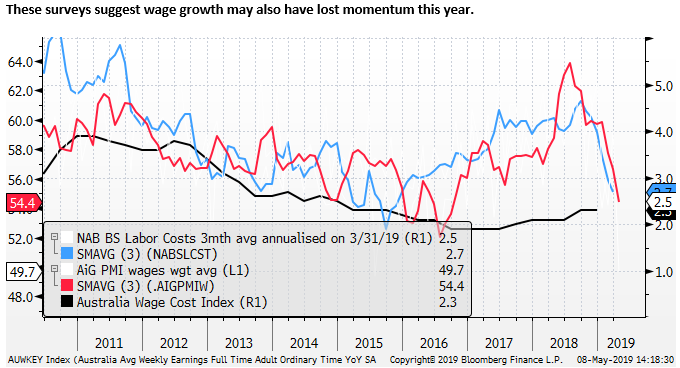
However, just as recent business surveys suggest that employment growth may slow, their indicators of wage costs have also fallen suggesting there is a risk that wage growth may stall.
The AiG PMI survey shows weaker wages for its three sector surveys. A weighted average of these components, in fact, fell to a low since 2009.
The NAB business survey (April data due next week) showed wages growth at an annualised rate of 2.7% in Q1, down from a peak of 4.6% in Q3 last year.