BoJ and Fed focus, some risk the Fed sound less hawkish
In the wake of the very dovish stance taken by the ECB, firmly communicated by its President Draghi last week, and the push-back on rate hike expectations in the UK by BoE Governor Carney, the market is keenly watching the FOMC statement on Wednesday and the BoJ policy statement on Friday. Judging by comments made by BoJ’s Kuroda on Friday, we anticipate little change in the BoJ statement. Kuroda is not seeing any significant pull-back in inflation expectations and appears in a mood to wait for a few more months to see how conditions evolve at home and abroad (this may weaken EUR/JPY). The Fed is also likely to avoid saying too much at this stage, so soon after hiking last month. However, some Fed members have expressed caution over lower inflation expectations. It is possible that the Fed want to use this statement to argue recent developments (including a tightening in financial conditions, recent ebbing in economic activity, greater uncertainty over China and the implications of lower oil prices) lessen the need for a follow-up hike in March. If so, the USD is likely to weaken. Having advocated long AUD positions to express a recovery in risk appetite, I am also keenly watching the Australian CPI data on Wednesday. The RBNZ policy meeting is unlikely to deliver any policy change this week. After a lull mid-year, economic activity in NZ has firmed. Inflation remains too low for the RBNZ, but underlying measures were stable and some even rose a little in Q4 (despite the weaker headline result).
Australian CPI – underlying measures skirting low side of the band
Last week I expressed some confidence in the capacity of the AUD to strengthen in a risk recovery, noting that the Australian economy had improved its overall momentum over the course of last year, working through the headwinds from the downswing in resource sector investment, and significantly advanced in rebalancing the economy.
However, there is still some way to go, and the most recent indicators tracking the last two months of last year and January have lost some momentum. Business confidence and activity have dipped, and are around neutral or long run average levels. Consumer confidence has dipped a bit to just below neutral levels. Housing indicators are more mixed recently.
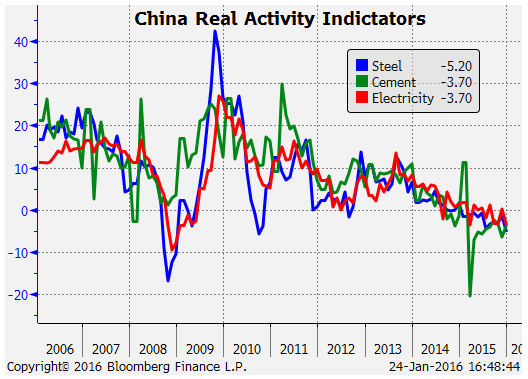
While Australia has been less responsive to Chinese economic reports of late, the activity indicators in China last week were weak, especially with regards to heavy industries and residential construction. As such, the Australian resource sector is likely to remain subdued.
This week the focus will be on the CPI report. In Q3, the CPI was significantly lower than expected. In response the RBA lowered its CPI forecasts over the coming year and stated that “the outlook for inflation may afford scope for further easing of policy, should that be appropriate to lend support to demand.”
In The November Statement on Monetary Policy (updated next week), the RBA said, “The September quarter inflation outcome was lower than expected. While quarterly inflation outcomes can be volatile, the broad-based nature of the weakness in the September quarter suggests that inflationary pressures are a bit more subdued than earlier anticipated. As a result, the inflation forecasts are lower in the near term. Underlying inflation is now expected to be around 2 per cent over most of next year before picking up to be around 2½ per cent.” (The RBA targets a 2 to 3% band for inflation).
As it stands the key underlying measures of inflation (trimmed mean and weighted median were 2.1 and 2.2% y/y respectively in Q3 – near the bottom of the 2 to 3% target band). The market is forecasting both at 2.1%y/y in Q4. While expectations are tightly bunched, these data can surprise from time-to-time.
The AUD TWI averaged higher in Q4 than Q3, but was significantly lower than the first half of the year. As such, we might expect the lower exchange rate over recent years to add to inflation.
The RBA notes that so-far the pass-through from the weaker exchange rate over recent years has been lower than expected. It acknowledged that low wages and competitive pressures may be contributing to lower inflation outcomes.
The underlying measures of inflation have rarely ventured below the 2.0% base in the medium term inflation target; the last time they were both below was in 1997/98.
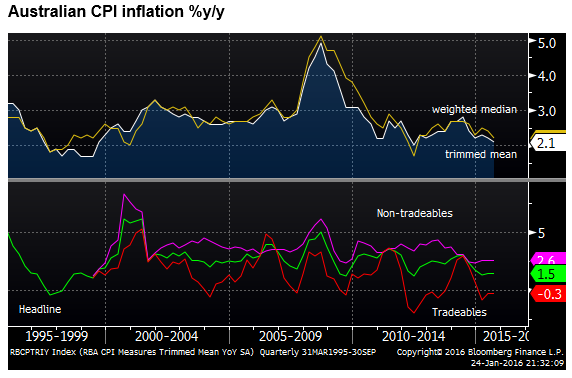
We have no particular bias to expect this data to be above or below the market expectations. A fall to sub-2% might trigger a bit of pressure to cut rates on the basis that the RBA risked undershooting its target for longer than might be considered consistent with its mandate.
There is little near term pressure for the RBA to move rates, and no change is the firm favorite outcome at its next policy meeting next week.
BoJ expected to show patience
The BoJ policy decision on Friday is one to watch in the wake of the ECB guidance of a probable further policy easing slated for its next policy meeting on 10 March. The stronger JPY, lower oil prices, weaker Chinese growth, and lower wage increase claims by auto-workers suggest that there is a risk that the BoJ surprise with an expansion in its QE this week.
However, BoJ Governor Kuroda appeared to play down the shifts in inflation risks to the downside in his press outings at Davos last Friday. No one at the BoJ appears to be considering zero or negative rates.
Some have argued that Kuroda has in the past played it cool just ahead of policy meetings, including the last big-surprise easing in Oct-2014. However, we have to conclude that Kuroda wants to see how conditions pan out for a few more months. He has also proved extremely patient. Policy has only been adjusted once since his opening QQE salvo in April 2013.
In contrast to Draghi, Kuroda down-played the fall in inflation expectations and noted that excluding oil, inflation in several major economies (the US, UK and Japan) was above 1%, and was likely to rise over time as oil prices bottom and recover (he thinks).
He thinks inflation expectations have taken hold in Japan and, while acknowledging the risks, appears much calmer than the rhetoric from the ECB
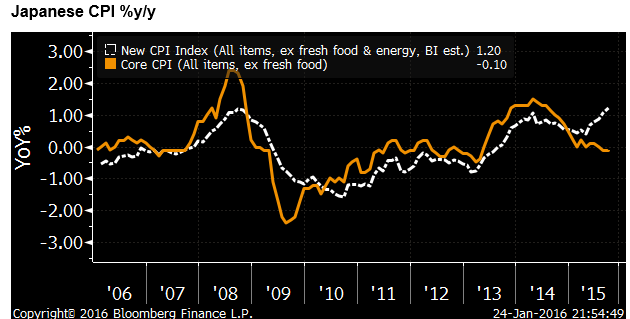
Just head of the BoJ meeting on Friday, Japanese CPI data for December is released, and presumably this will feature in the BoJ discussion. In November, the core measure favored by the BoJ rose to 1.2% (CPI ex-fresh food and energy), a long term high. The market appears to expect no change in the annual growth in this index.
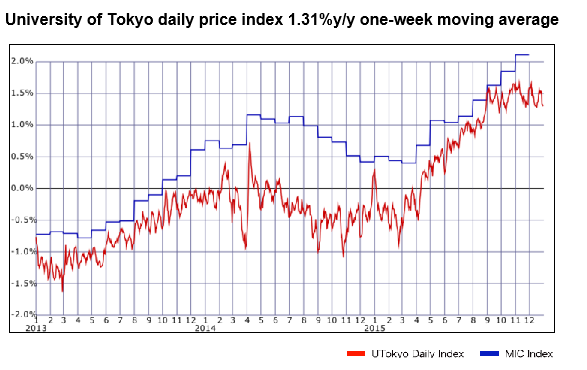
Two of the big-data daily price indices in Japan, also followed by the BoJ, appear to show inflation trends relatively stable over the last quarter.
Fed is not likely to say much new, but there is a risk towards less hawkish
The FOMC also release its first policy statement for the year, and the first after it raised interest rates at its previous meeting. Since this meeting involves no Yellen press conference and no update on the Fed’s forecasts, there is less expectation on the Fed to alter its stance.
The Fed may think it is too soon to shift its judgement on the economy since deciding on a hike last year. In the previous statement it already said that, “The Committee expects that economic conditions will evolve in a manner that will warrant only gradual increases in the federal funds rate; the federal funds rate is likely to remain, for some time, below levels that are expected to prevail in the longer run. However, the actual path of the federal funds rate will depend on the economic outlook as informed by incoming data.”
Even if the risks have been tilted towards the Fed staying on hold for longer, the previous statement encapsulates this capacity to pause at one or a few meetings if required. As such, the wording of the statement does not need to change too-much.
However, there is a risk that the Fed wants to message some less urgency to hike, and express caution around recent further significant falls in market-based measures of inflation expectations, tightening in financial condition, greater uncertainty over the outlook for the China and other emerging markets, the dampening effects lower oil prices may have on the US energy sector, and some recent ebbing in economic activity, including higher unemployment claims in recent months.
It may feel, it would be helpful in sustaining broader market confidence by highlighted the factors that may delay further tightening in the near term. If so, we might expect the USD to soften in response.
If as we expect the BoJ to keep policy unchanged with little change in its inflation outlook, we might expect EUR/JPY to weaken. USD/JPY may depend more on the state of global risk appetite and the tone of the FOMC statement.
Economic News over the Last Week
USA
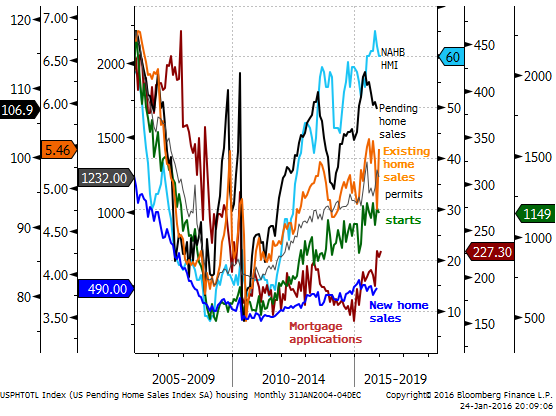
NAHB Housing market index 60 in Jan, a bit below 61 expected, unchanged from Dec, revised down from 61.
Mortgage applications index for house purchase 4-week moving average 219, down modestly from a recent peak of 227 in Dec, holding above previous peaks since 2010.
Housing starts -2.5%m/m, weaker than +2.3% expected, after rising 10.1% in Nov. Stable around its current level since March, at around the high level since 2007.
Building permits fell 3.9%m/m in Dec, stronger than -6.4% expected, after rising 10.4% in Nov. Permits have rebounded in the last two months to around the peak level around mid-year; the high since 2007.
Existing home sales +14.7%m/m in Dec, stronger that +9.2% expected, after falling 10.5% in Nov.
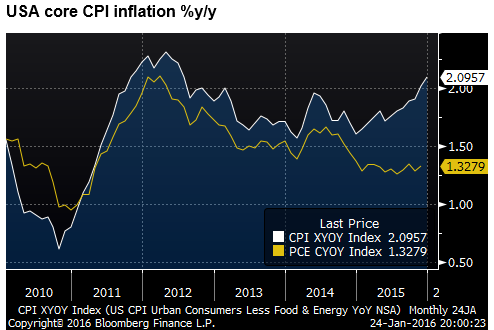
CPI +0.7%y/y in Dec, weaker than +0.8% expected, up from 0.5%y’y in Nov
Core CPI +2.1%y/y in Dec, as expected, up from 2.0%y/y in Nov. A high since July 2012, and above the Fed target. Running significantly ahead of the Fed’s preferred underlying measure of inflation, the PCE deflator at 1.3% in Nov.
Initial jobless claims 4 week moving average 285K last week, a high (weakest) since July 2015.
Markit flash PMI manufacturing 52.7 in Jan, above 51.0 expected, up from 51.2 in Dec. Up from a low in Nov in data avail since 2013, at the second weakest level since Oct-2013.
Chicago Fed National Activity index -0.22, below -0.15 expected, up from -0.36 in Nov (revised down from -0.30). -0.24 3mma in Dec, low since May-2013.
Leading index -0.2%m/m in Dec, as expected, after rising 0.5%m/m in Nov, revised up from +0.4%m/m
Australia:
Business confidence fell from +5 to +3 in Dec. Flat trend a little below the long run average around +5.
Business conditions fell from +10 to +7; a low since April-2015; a little above the long run average around +5. Employment component fell from +2 to zero. Forward orders rose from +2 to +4. Labour costs rose 0.6%q/q in Dec, up from 0.5%q/q in Nov, a high since Sep-2015.
New vehicle regos +2.2%y/y in Dec, down from +6.0%y/y in Nov. 4.0% 3mth-yoy, low since Aug-2015. Maybe slowing from a solid rate.
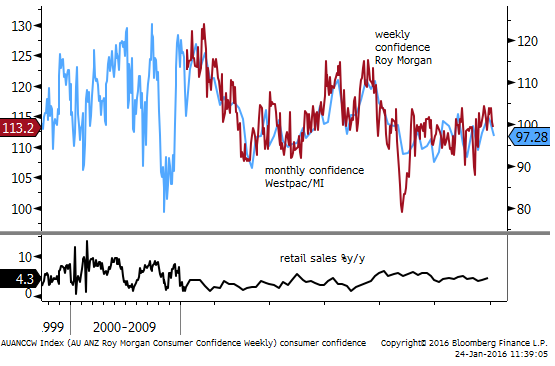
Consumer confidence 97.3 in Jan, down from 100.8 in Dec. Down on recent equity market weakness. Somewhat above average over recent years, modestly below the long run average.
New home sales fell 2.7%m/m in Dec, down for a third month in a row. Down from a peak in April 2015. Slowing housing market.
New Zealand:
CPI inflation: +0.1%y/y in Q4, below 0.3% expected, down from 0.4%y/y in Q3.
Non-traded goods +1.8%y/y in Q4, up from 1.5%y/y in Q3. Traded goods inflation -2.1%y/y in Q4, down from -1.2%y/y in Q3.
RBNZ Statistical underlying measures: Sector Factor model +1.6%y/y in Q4, up from 1.5%y/y in Q3. Factor model 1.3%y/y in Q4, up from 1.2%y/y in Q3.
Weighted Median +1.8%y/y in Q4, up from 1.7% in Q3 (using 2011 weights). +1.5%y/y in Q4, unchanged from Q3 (using 2014 weights).
The 10% trimmed mean +0.7%y/y in Q4, slowed from +1.0% in Q3, a low since at least 2012 (using 2011 weights); +0.4%y/y, slowed from 0.7% (using 2014 weights).
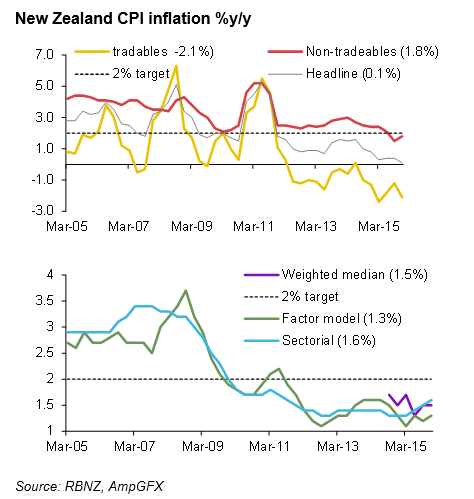
The headline was much weaker than expected, but the underlying measures were slightly firmer. The low traded goods sector inflation, reflecting a lower oil price. The RBNZ is eager to get inflation back to 2%, and underlying measures persist around 1.5%. The pressure remains for more easing, although this data was not as negative on the inflation outlook as the headline miss suggested.
REINZ House Sales volume rose 2.9%m/m seasonally adjusted in Dec, and 3.5%y/y non-seasonally adjusted, down from +8.5%y/y in Nov. After rapid growth in late-2014 to mid-2015, sales have levelled-off. Sales rose +10.2% 3mth-yoy in Dec, a low growth since Dec-2014.
In Auckland, New Zealand’s largest city on which the RBNZ has imposed further restrictions on the max LVR for investors since October, sales rose 8.3%m/m s.a. in Dec, but fell 18.6%y/y n.s.a.
Excluding Auckland, sales rose 17.5%y/y n.s.a. in Dec.
The median house price rose 1.6% s.a. in Dec, and 3.3%y/y n.s.a. down from 7.0%y/y in Oct, and a recent peak of 15.4%y/y in Sep. This data is volatile since it is not stratified, thus making it hard to judge the pace of price growth.
Excluding Auckland, the median house price rose 8.0%y/y n.s.a.
REINZ Chief Executive Colleen Milne says, “Regional markets, particularly Northland, Waikato/Bay of Plenty, Hawkes Bay and Central Otago Lakes are now setting the pace for the New Zealand real estate market, with Auckland, in a relative sense, now in the middle of the pack. The decline in sales volume in Auckland, while noticeable, is likely transitory as the region gets to grips with the new LVR rules for investors, although the median price continues to firm.”
Job advertisements rose 1.1%m/m in Dec, after rising 2.4%m/m in Nov (revised up from 2.0%). Ads have been rising solidly for 4 months in a row, reversing a falling trend in the first 8-months of 2015, and rising to a new cyclical high.
PMI manufacturing 56.7 in Dec, up from 54.9 in Nov, a high since Oct-2014. Three month average 55.0, high since Dec-2014.
Consumer confidence 121.4 in Jan, up from 118.7 in Dec, up from a recent low of 110.0 in Aug, still below levels in the first half of 2015, around its long run average.
Japan
Trade balance +0.04tn JPY, close to expected, after +0.02tn in Nov. Close to balanced, in surplus for the first time since Feb-2011.
Exports fell 8.0%y/y, weaker than -7.0% expected, down from -3.3%y/y in Nov; low growth since Sep-2012. Imports fell 18.0%y/y in Dec, low since 2009.
Tertiary Industry index fell 0.8%m/m in Nov, a bit weaker than -0.7% expected, after rising 0.7%m/m in Oct (revised down from 0.9%). The index has fallen 0.2%m/m on average over the last three months, and has been flat on average over six months.
Department store sales rose 0.1%y/y in Dec, after falling -2.7%y/y in Nov. They rose 0.5% 3mth-yoy in Dec
Convenience store sales rose 1.4%y/y in Dec, after rising 0.9%y/y in Nov. They rose 1.6% 3mth-yoy in Dec.
Supermarket sales were flat %y/y in Dec, after falling 1.0%y/y in Nov. Sales rose 0.6% 3mth-yoy.
PMI manufacturing flash 52.4 in Jan, below 54.8 expected, down from 52.6 in Nov. Three month average 52.5.
China
Industrial production rose 5.9%y/y in Dec, weaker than 6.0% expected, down from 6.2%y/y in Nov. Three month average: 5.9% 3mth-yoy.
Crude steel output -5.2%y/y in Dec, down from -1.6%y/y in Nov, low since 2010
Cement output -3.7% y/y in Dec, up from -6.6%y/y in Nov
Electricity Output -3.7%y/y in Dec, down from +0.1%y/y in Nov, low since 2009.
Retail sales +11.1%y/y in Dec, weaker than 11.3% expected, down from 11.2%y/y in Nov. Three month average: 11.1% 3mth-yoy.
Fixed Asset Investment 10.0% year-to-date/year-over-year (ytd-yoy), weaker than 10.2% expected, down from 10.2%ytd-yoy in Nov. Record low since 2000.
Investment in metals sector in outright decline (Ferrous (iron) -12.0% ytd-yoy; non-ferrous -4.0% ytd-yoy); mining in metals falling faster (Ferrous -21.4%ytd-yoy; non-ferrous -10.9% ytd-yoy).
Investment growth concentrated in telecommunications, electrical and general-purpose equipment. And public facilities and utilities.
GDP rose 6.8% y/y in Q4, weaker than 6.9% expected, down from 6.9%y/y in Q3; a Low since 2009. Outside of 2009, the lowest year-over-year growth since 1990.
Growth in the quarter was 1.6%q/q in Q4, down from 1.8%q/q in Q3 and 1.9% in Q2, but up from 1.3%q/q in Q1, the weakest quarter in data available since 2011.
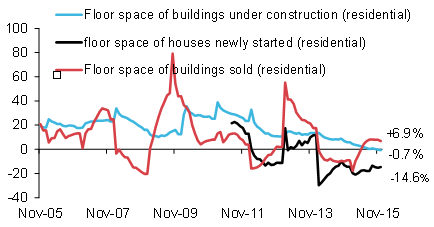
Residential housing: Under construction -0.7%y/y (low in data avail since 2005), newly started -14.6%y/y (negative since Feb-2014).
Residential sales (volume) +6.9%y/y in Dec, down from a recent peak of 8.2%y/y in Sep, rising since May-2015.
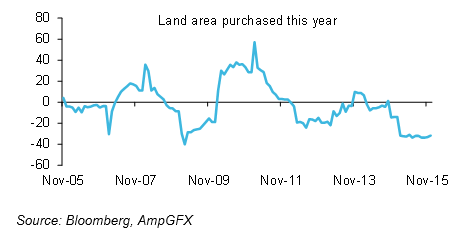
Land area purchased -31.7%y/y, falling around this rate since Feb-2015.
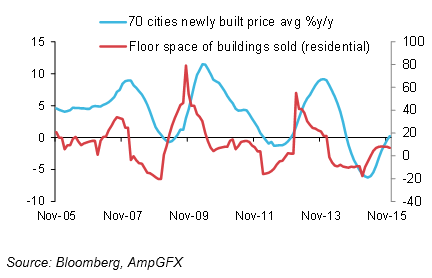
The price of newly built houses rose slightly from a year earlier in December for the first time since Aug-2014; up from a low growth rate of -6.3%y/y in April-2015. However, with sales moderating in recent months, price gains may be limited.
UK
CPI inflation 0.2%y/y in Dec, as expected.
Core inflation 1.4%y/y in Dec, above 1.2%y/y expected, up from 1.2%y/y in Nov; a high since Jan-2015.
Jobless claims -4.3K in Dec, stronger than +2.8K expected, revised stronger to -2.2K in Nov, from +3.9K.
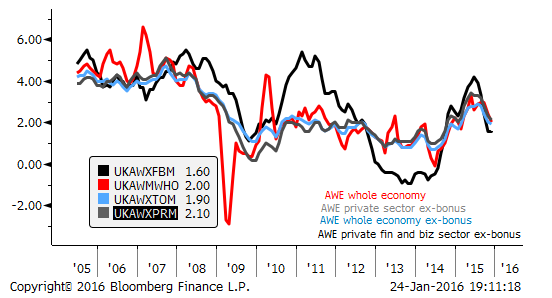
Average weekly earnings +2.0% 3mth-yoy in Nov, below 2.1% expected, down from 2.4% 3mth-yoy in Oct. Excluding bonus, earnings were 1.9% 3mth-yoy, firmer than 1.8% expected, down from 2.0% in Nov.
Unemployment rate 5.1% in the three months to Nov, stronger than 5.2% expected, down from 5.2% 3mma in Oct a low since 2005.
Employment growth 267K 3m/3m in Dec, stronger than 235K expected, up from 207K in Nov.
RICS house price balance +50 in Dec, as expected, up from +49 in Nov.
Retail sales +2.6%y/y in Dec, weaker than +4.4% expected, down from +4.5%y/y in Nov (revised down from 5.0%).
Excluding auto fuel, sales were+2.1%y/y in Dec, weaker than 3.5%y/y expected, down from 3.4%y/y in Nov (revised down from 3.9%), A low since Nov-2013. Sales were thought to be dragged down by warm weather dinting winter clothes sales.
Eurozone
Current Account balance 26.4bn n.s.a. in Nov, stable around this record level since Sep-2014.
Construction output +2.1%y/y in Nov, up from 0.8%y/y in Oct (revised down from 1.1%). A high since May-2014.
Core CPI final unrevised at +0.9%y/y in Dec, unchanged from Nov, down from 1.1%y/y in Oct.
Consumer confidence -6.3 in Jan, down from -5.7 in Dec. Down from a peak of -3.6 in Mar-2015. Still around the highs since 2007
PMI manufacturing flash 52.3 in Jan, weaker than 53.0 expected, down from 53.2 in Dec. Three month average 52.8 in Jan 3mma.
PMI Services flash 53.6 in Jan, weaker than 54.2 expected, down from 54.2 in Dec. Three month average 54.0 in Jan 3mma. At a low since Jan-2015.
Canada
Retail sales +1.7%m/m in Nov, stronger than +0.2% expected, after rising 0.1%m/m in Oct. Sales rose 2.3% 3mth-yoy in Nov, firming from a low growth rate of +1.9% 3mth-yoy in Jul/Aug. Excluding autos sales rose 1.1%m/m in Nov, stronger than 0.4% expected, after flat in Oct.
CPI inflation +1.6% y/y in Dec, below 1.7% expected, up from 1.4%y/y in Nov, a high since Nov-2014.
Core CPI +1.9%y/y, below 2.0% expected, down from 2.0%y/y in Nov; a low since July-2014.
On the Radar
USA
- 25 Feb – Dallas Fed manufacturing index
- 26 Feb – House prices, Markit PMI Services flash, CB Consumer confidence, Richmond Fed manufacturing index
- 27 Jan – FOMC meeting
- 27 Jan New Home sales
- 28 Feb – Durable goods orders, pending homes sales, Kansas City Fed manufacturing
- 29 Feb – ECI
- 29 Jan- GDP Q4 advanced estimate
- 1 Feb – PCE deflator
Australia
- 27 Jan – Q4 CPI inflation
- 27 Jan – skilled vacancies, NAB Q4 Business confidence
- 29 Jan – Credit growth
- 1 Feb – PMI manufacturing, House prices
- 2 Feb – RBA rates decision
- 3 Feb – Trade balance, PMI services, Building approvals
- 5 Feb – PMI construction, retail sales
- 5 Feb – RBA quarterly Statement on Monetary Policy.
New Zealand
- 26 Jan – PMI services
- 27 Jan – PM Key speech
- 28 Jan – RBNZ rates decision
- 28 Jan – Trade balance
- 29 Jan – Building permits, credit growth
- 1 Feb – Net Migration, Treasury monthly economic indicators
- 2 Feb – Labor and wages data
- 3 Feb- RBNZ Governor Wheeler speech.
Eurozone
- 25 Jan – German IFO
- 27 Jan – German retail sales
- 28 Jan – EC economic surveys
- 28 Jan – German CPI
- 29 Jan – CPI advance estimate
- 2 Feb – unemployment
- 3 Feb Retail sales
- 5 Feb – German factory orders
UK
- 25 Jan – CBI Industrial Trends Survey
- 27 Jan – BBA loans for house purchase
- 28 Jan – GDP Q4
- 2 Feb – Mortgage approvals, credit growth, BRC Shop price index
- 2 Feb – PMI manufacturing
- 3 Feb – PMI construction
- 4 Feb – PMI Services
- 5 Feb – car regos
- 5 Feb – BoE policy
Canada
- 28 Jan – CFIB Business barometer
- 29 Jan – Monthly GDP
- 1 Feb – PMI manufacturing
- 5 Feb – trade balance
- 5 Feb – employment/ unemployment
Japan
- 27 Jan – Small business confidence
- 28 Jan – Retail sales
- 29 Jan – unemployment, CPI, IP, Household spending
- 29 Jan – Vehicle production, Housing starts, Construction orders
- 29 Jan – BoJ policy
- 1 Feb – Vehicle sales
- 3 Feb – PMI services, consumer confidence
- 8 Feb – Current account balance, Labor cash earnings
China
- 27 Jan – Industrial profits
- 1 Feb – Govt PMI manufacturing and non-manufacturing
- 1 Feb – Caixin PMI manufacturing
- 3 Feb – Caixin PMI services