Broadening evidence of global economic recovery
In our first note for 2017 we are not ready to draw any significant conclusions for global currency markets. It is evident that a significant correction in the USD has occurred in the first week of the year. This may reflect significantly stronger than expected economic indicators in a range of countries other than the USA, suggesting that a cyclical upswing in the global economy is underway since around Q4 last year, helping lift support for global asset prices and investment outside of the USA. It may reflect a natural cooling in the outlook for the Trump-effect on the USA economy after a surge of optimism late last year. It may reflect a spillover from a rebound in Chinese yuan engineered by a squeeze in offshore CNH liquidity. CNH volatility around the turn of the year is starting to look like a regular occurrence, after similar developments a year earlier.
Signs of recovery broaden in Asia
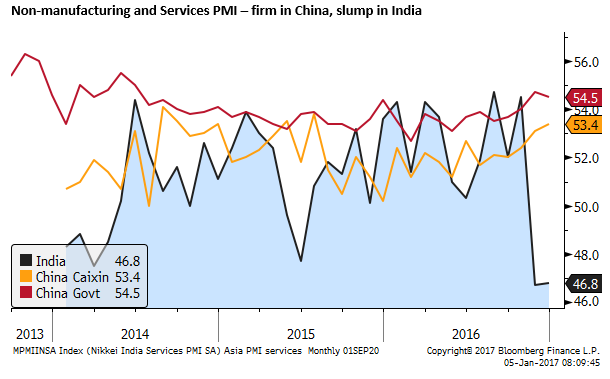
China’s Caixin services PMI that reflects more private-sector firms (released on Wednesday 4 Jan), rose to 53.5 in Dec, a high since July-2015 (17 months). The government non-manufacturing PMI (released on Sunday 1 Jan) dipped in Dec to 54.5 from a high in November since June 2014, but was still a relatively robust result.
As the chart below shows, the Indian services PMI failed to recover much from its slump in November triggered by disruption created by the government’s poorly implemented currency note replacement intended to crack-down on the black market.
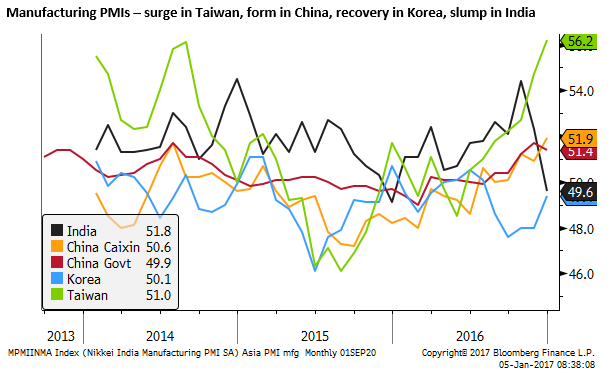
China’s Caixin manufacturing PMI (released on Tuesday 3 Jan) rose to 51.9 in Dec, stronger than 50.9 expected) a high in over three years of data available on Bloomberg since Sep-2013. China’s government PMI (released on Sunday 1 Jan) that includes more state-owned enterprises dipped to 51.4 from its high in November since July-2014.
The chart below shows a rapid recovery in the Taiwanese PMI in the last two months to a high in at least three-years of 56.2. A solid recovery in the Korean PMI to 49.4 in Dec. However, the Indian PMI slumped for a second month to a low in 12 months of 49.6 from a high in October since Dec-2014 of 54.4. (Most Asian PMIs released on Tuesday/Wednesday 3/4 Jan).
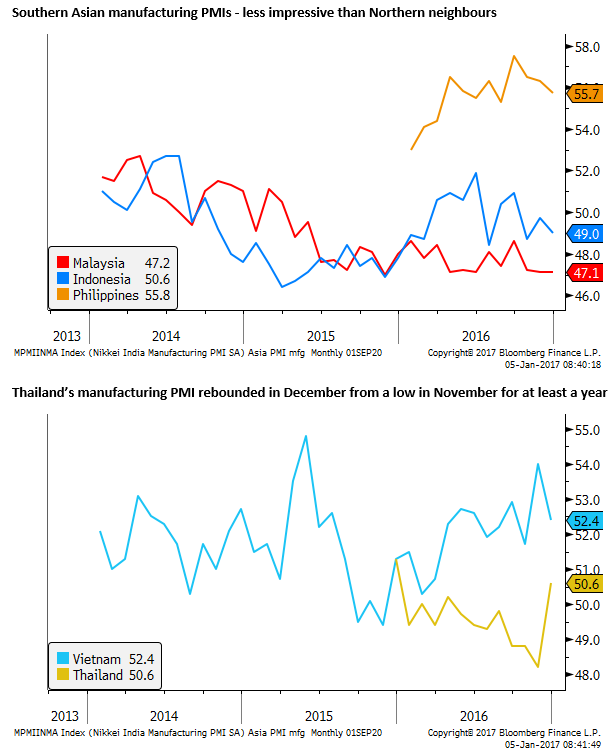
The Malaysian and Indonesian manufacturing PMIs were less impressive than their northern Asian neighbours. And the Phillippines, while at a stronger level, was down for a third month in December.
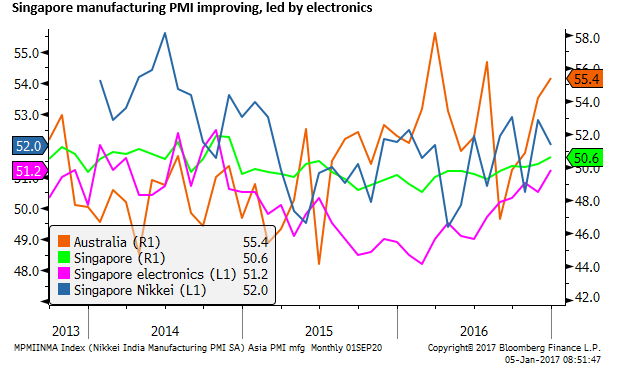
Singapore’s electronics PMI continued its recovery from a low early last year to a high in December of 49.5 since October 2014. Its overall manufacturing PMI has followed suit, albeit rising more gradually, to a high of 50.6 in Dec since Nov-2014. The Nikkei sponsored Singapore PMI dipped in Dec to 52.0.
The chart below also shows the highly erratic Australian manufacturing PMI that has risen from a low last year in August of 46.9 to a 55.4 in December, a high since July.
Stronger Export trends in Asia
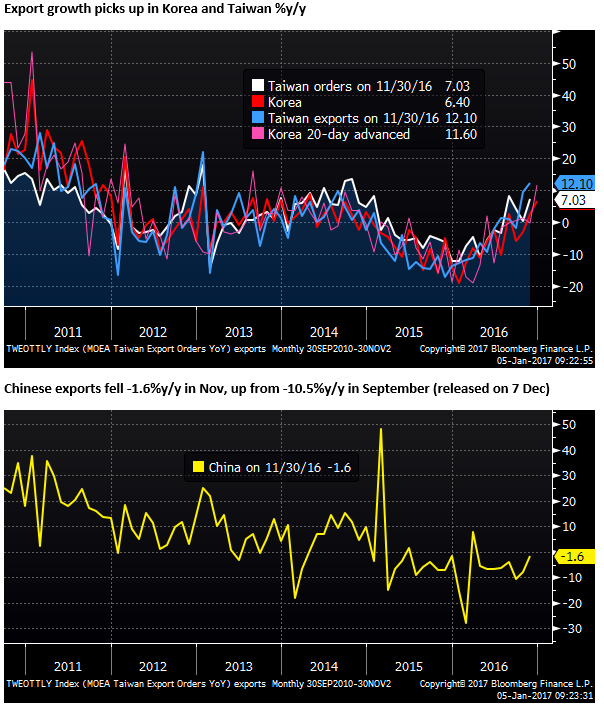
Korea is the first Asian country to report exports in December. With a weak end to 2015, year-over-year comparisons may exaggerate the appearance of strength, but Korean exports rose 6.4%y/y in Dec, above 4.6% expected, a high growth rate since April-2014.
The chart below also shows Taiwanese exports and export orders. In November, Taiwanese exports rose 12.1%y/y, a high since Jan-2013 (released on 7 Dec). Orders rose 7.0%y/y in Nov, above 5.0% expected (released on 20 Dec).
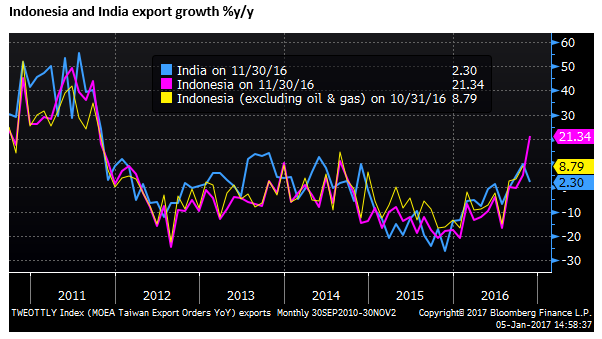
Indonesia’s exports surged 21.3%y/y in November, supported by higher commodity prices rebounding from a low base in late 2015.
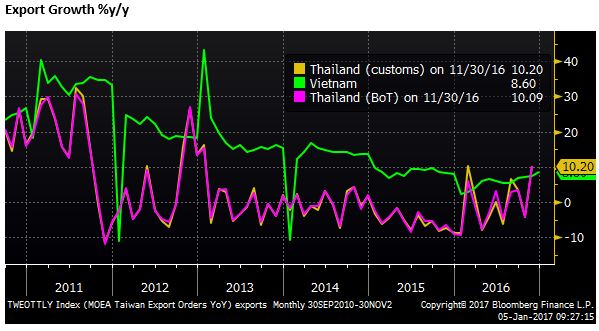
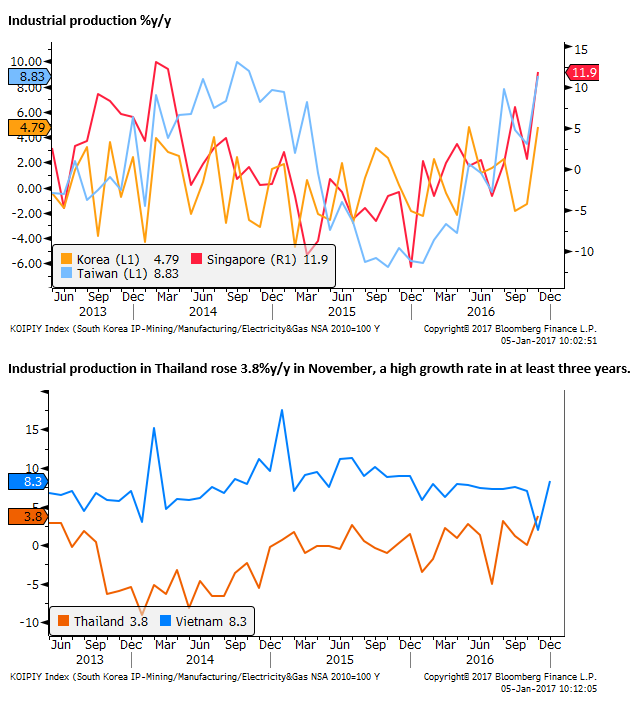
Thailand’s exports rose over 10%y/y in November, a high growth rate in almost four years. Vietnam’s exports rose 8.6%y/y in December a 12-month high growth rate.
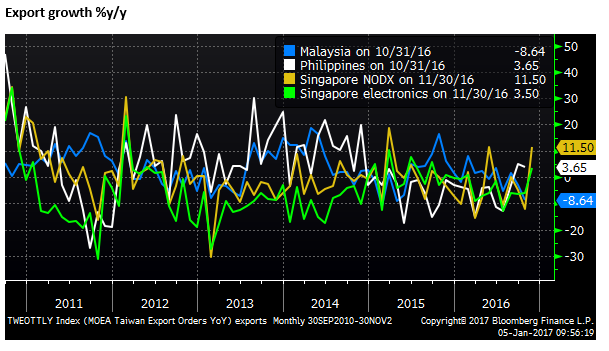
Singapore’s non-oil domestic export growth rose to 11.5%y/y in November, equaling its previous high since March 2015.
Industrial production recovers in advanced Asian countries
Industrial production rose at the highest annual rate in Taiwan in November (8.8%y/y) since Oct-2014, in Korea (4.8%y/y) in at least three years, and Singapore (11.9%y/y) since Mar-2014.
Australian PMI and business credit recover
Australian PMI data tends to be erratic. Nevertheless, it is notable that manufacturing and service-sector readings have recovered from lows for the year in August. Manufacturing is up from 46.9 in Aug to 55.4 in Dec. Services are up from 45.0 in Aug to 57.7 in Dec, a high since May 2007. The construction PMI has been relatively weaker in recent months (46.6 in Nov); its December reading is due on Monday 9 Jan.
The AiGroup that release the PMI data wrote that respondents to the services PMIs survey noted “increased orders from the mining sector; a lower value for the Australian dollar; interest rates remaining stable and (for regional services) good agricultural harvests. Overall, there was a sense of increased confidence from respondents across many services sub-sectors.”

Australian credit growth (released on 30 Dec) showed rising momentum for business and housing investor credit growth. Business credit growth has risen on a 3mth moving average basis from a low in August to a high in November since May. Housing investor credit growth has been building momentum since around mid-2016 to a high since Sep-2015.

Total credit growth 5.4%y/y, business credit growth 4.9%y/y, housing credit growth 6.3% (investor 5.6%, owner-occupier 6.7%)

Global services sector firms
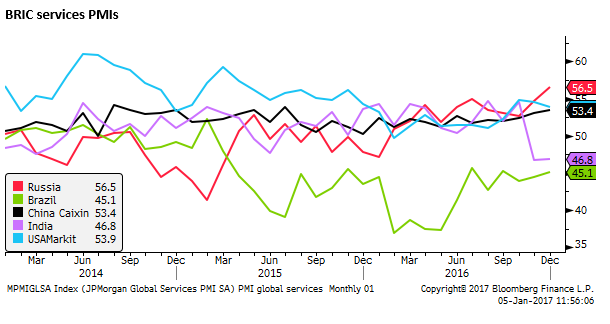
The Global services PMI was steady in Dec at 53.3, remaining at a high in just over a year. The emerging market services PMI rose to 51.8 in Dec, a high since August.
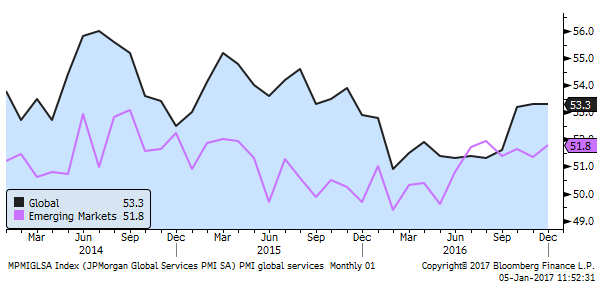
India continued to be the main drag on the emerging market PMI, with a rise in Russia to 56.5, a high in at least three years, and firmer results in Brazil and China.
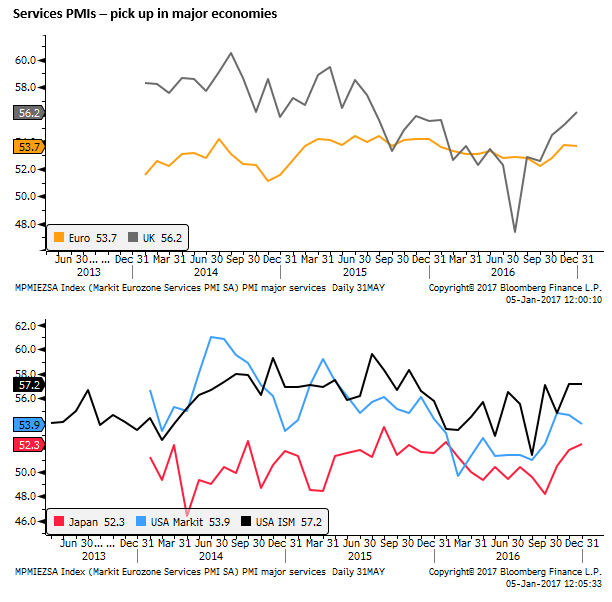
The UK services PMI (Released on Thursday 5 Jan) rose to 56.2 in Dec, above 54.7 expected to a high since July 2015. The Eurozone services PMI was revised up from its initial reading of 53.1 to 53.7 in Dec, down a touch from a recent high of 53.8 in November.
The US Markit services PMI was also revised up from an initial reading of 53.4 to 53.9 in Dec, but this was down from 54.6 in Nov and a recent high of 54.8 in Oct. However, the more closely watched and broader non-manufacturing ISM measure was stable at 57.2 in Dec, stronger than 56.8 expected, remaining at a high since October 2015.
The chart below also shows the Japanese services PMI rising to 52.3, a high since January 2016.
Global manufacturing picks up
The Global manufacturing PMI rose to 52.7 in Dec, a high since Feb-2014. The emerging markets manufacturing PMI rose to 51.2 in Dec, a high since July 2014.
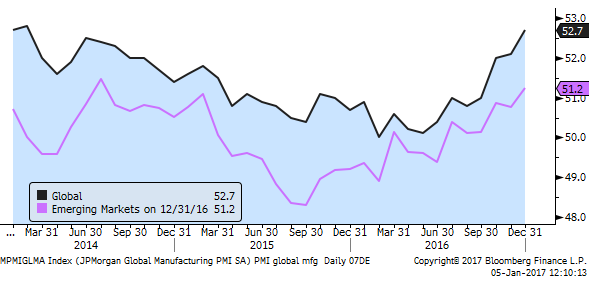
In the large emerging countries, Russia’s manufacturing PMI firmed to 53.7 in Dec, a high in at least 3 years. However, weaker results were seen in Brazil and especially India.

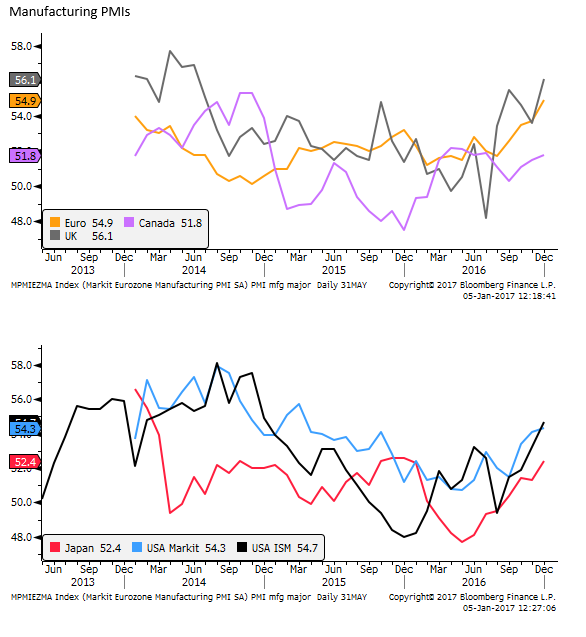
In the UK, the manufacturing PMI rose to 56.1 in Dec (released on 3 Jan), a high since June 2014. In the Eurozone (unrevised on 2 Jan from the initial reading), the manufacturing PMI rose to 54.9 in Dec, a high in at least three years.
The USA markit manufacturing PMI rose to 54.3 in Dec, revised slightly higher from an initial reading of 54.2 (released on 3 Dec), a high since March 2015. The more closely watched manufacturing ISM report rose to 54.7 in Dec, above 53.8 expected, a high since Dec-2014 (released on 3 Jan).
The chart below also shows the Japanese manufacturing PMI that rose to 52.4 in Dec, revised up from an initial reading of 51.9 (released on 4 Jan) to a high since Dec-2015.
CNH turmoil – Again
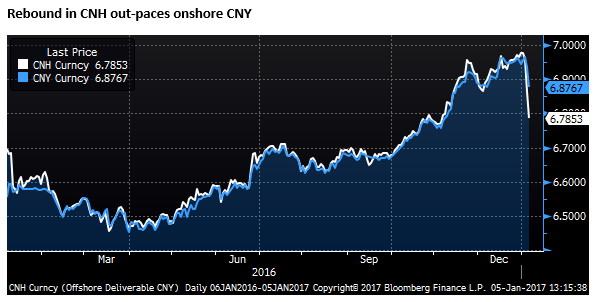
A striking feature of the currency market on Thursday was a rebound in the Chinese yuan. While some of this may relate to a broad retracement in the US dollar’s strength and may also be helping drive a broader down-move in the USD, in most respects the rebound in CNY appears engineered by the Chinese government via a squeeze in liquidity particularly in the so-called offshore market based in Hong Kong.
CNH (offshore deliverable yuan) related interest rates have shot up to make it costly for speculators to borrow and (short-sell) CNH. The chart below shows Hibor (CNH lending rates) have risen to over 38% for overnight terms and to around 10% for a three-month term.
The chart also shows the spread between spot CNH and CNH three months forward. This spread has blown-out, making it more expensive to buy USD and sell CNH in three-months, fully reflecting the higher cost of borrowing CNH in the Hibor market.

The squeeze in Chinese yuan has occurred mainly in the offshore market with interest rates remaining relatively normal in domestic Chinese markets. Similarly, the squeeze higher in USD/CNH forward exchange rates has occurred mainly in the offshore market. Both CNH and non-deliverable CNY forwards that benchmark to the domestic CNY market have rebounded against the USD, but the CNH has risen much further.
These events in Chinese currency and rates markets are becoming a regular event around the turn of the year. Similar market turmoil was apparent last January, with a spike to weaker levels (higher USD/CNH) early in the New Year that appeared to reflect increased speculative selling of the CNH on capital outflow expectations, followed by a squeeze in liquidity that forced speculators to close short CNH positions.
Last year the peak in USD/CNH occurred on 7 Jan and was associated with turmoil in the Chinese stock market and fears over financial stability in China. These fears calmed down considerably during 2016. The authorities have instilled more calm in the equity market after a volatile 2015 and slump to a new low in January 2016. Confidence in the Chinese economy has also improved after a broad modest recovery in growth in 2016 aided by fiscal policy, quantitative control via regulations, and relatively easy monetary policy.
The high volatility in CNY and CNH early last year was also part of broader global financial markets upheaval on the fear that slumping oil prices, weak global economic growth and a rate hiking cycle in the US might cause major global markets and economic disruption.
This year, there is considerably less fear of imminent financial and economic upheaval in China than there was 12 months ago. Global economic growth appears to be in a cyclical upswing, commodity prices are relatively strong, and global equity markets are coming off a strong finish to last year.
As such, it is much less likely that turmoil in the CNH currency market will spill over to a broader global asset market slump. Nevertheless, China does appear to be suffering a more persistent capital outflow trend that suggests there remains an underlying weakness in Chinese financial and economic conditions. There remains ongoing fear that China faces a reckoning from expanding its total economy credit growth at a rapid pace over the last six years or so.
The actions to squeeze out short CNH speculators this week may help stabilize the CNH through the next few months. It may be seen as a demonstration that the authorities are working harder to clamp down on capital outflows. There have been various reports in recent weeks that Chinese authorities are making its banks enforce rules that limit individual and company outflows. The rebound in CNH may be sufficient to calm fears that the authorities may be willing to see a more rapid fall in CNY.
However, if last year is any guide, the CNH may resume its weaker trend from Q2 onwards.
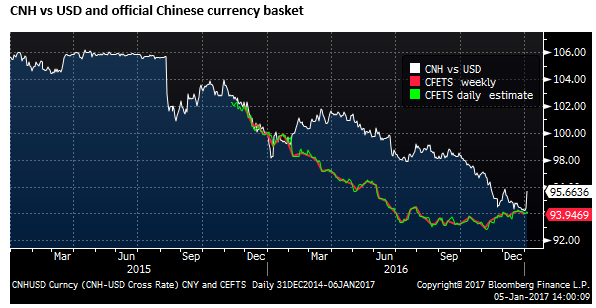
China moved to using a reference basket of currencies to manage the CNY in late 2015, and has reported the CNY index rate against this basket since late-2015. The further slide CNH in recent months should not necessarily have been alarming for Chinese investors since this basket index rate has in fact appreciated modestly (albeit after being allowed to slide significantly in the first half of 2015).
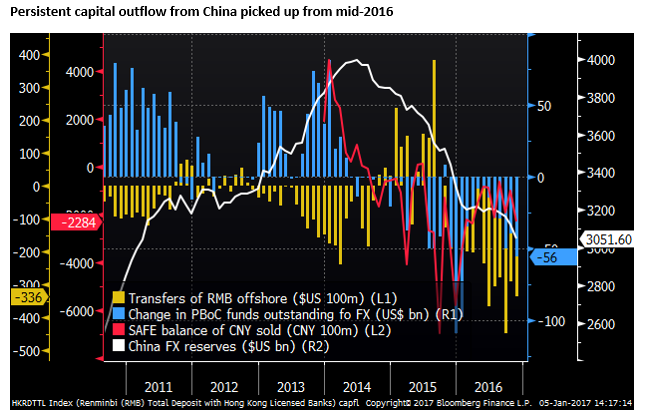
However, this appears to have been cold comfort to Chinese investors that appear more influenced by the USD/CNY exchange rate than a basket of currencies. By various measures, capital outflow from China picked up from around mid-2015 after a Q2 lull last year (chart below).
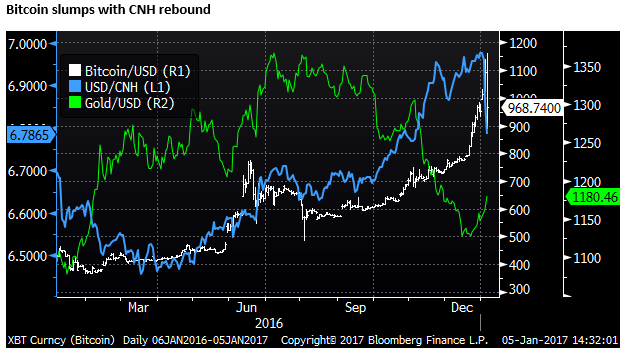
Capital outflow pressure in China has been bumping up against capital controls. One curious feature of the market is the high correlation between USD/CNH and bitcoin in the last year or so. It appears that Chinese investors may have been using purchases of bitcoin as an avenue to get funds out of CNY.
Bitcoin is extremely volatile and appears to be highly influenced by flows unrelated to fundamentals. Despite the fall in gold through the second half of last year, bitcoin continued to appreciate against the strong USD in a rapid fashion in recent months. This might be explained by Chinese demand after reaching limits on their capacity to buy foreign currency.
The sudden fall in Bitcoin in the last day, in line with the rebound in CNH, may signal some easing in capital outflow pressure, and confidence that the Chinese government will act to stabilize CNH in coming months. However, on the other hand this may simply be a correction in the highly volatile bitcoin after its recent spike to a record high, significantly out-of-line with any other currency or store of value, such as gold. It is difficult to read much into bitcoin movements.