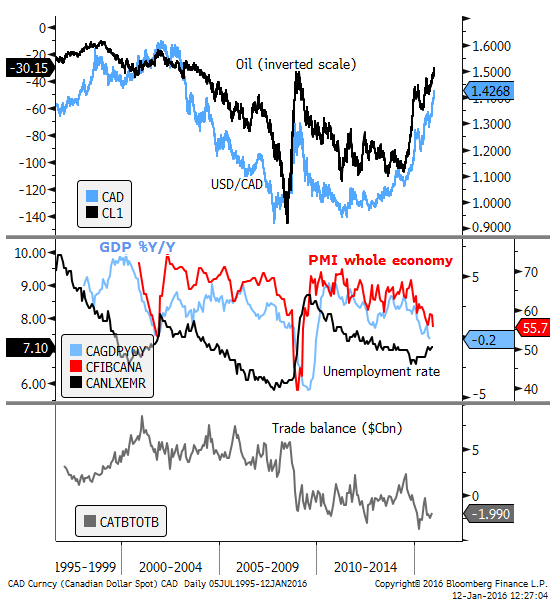
$CAD is still not cheap vs oil, trade balance and economic activity
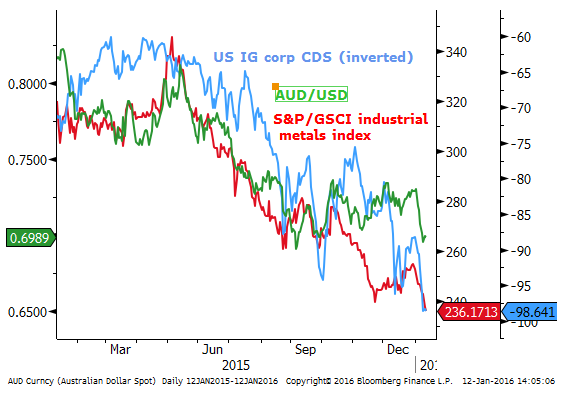
Oil has plunged further this year, adding to the weaker trend since November last year. Many analysts are now arguing that this is not sustainable, but the supply over-hang is severe and unlikely to be resolved for a long time. Broader commodity prices have also fallen to new long-term lows; outside of the 2008/09 GFC, industrial metals and agricultural indices are at their lows since the first half of the 2000s. Weaker commodity prices are contributing to higher global risk premiums. US corporate IG CDS has widened further than the peak at end-Sep last year, to a wide since 2012. The USD/CAD has risen sharply recently, remaining highly correlated with oil prices. However, compared to oil prices, the trade balance and economic growth momentum, CAD does not look cheap. AUD also looks vulnerable, especially if Chinese trade data reveal further weakness in commodity demand and the recent ebbing in Australia’s growth momentum extends to the Australian labour market report.
Oil price plunge adds to risk aversion
Commodity price falls have accelerated in recent months. Oil has plunged further this year, adding to the weaker trend since November last year; now hovering near $30 per barrel, from around $45 in Q3, $60 mid-2015 and $100 before mid-2014; trading at its low since 2003.
Weak energy prices have added to global risk aversion/premiums in the last year, placing pressure on many developing market economies including Brazil and Russia, generating political uncertainty in the Middle East (and other regions) as Iranian supply returns to the oil market and Saudi Arabia faces fiscal problems. Oil price falls have weakened high yield bond markets as pressure builds on highly leveraged energy investment projects established in the last decade of higher prices.
The fall in petro-dollars has seen sovereign wealth funds diminish, reducing demand for alternative reserve currencies, potentially raising their demand for USD to cover dollars lost to support their own-currencies.
The US economy has weakened somewhat as investment in its relatively new and until recently rapidly growing energy sector slows. However, US production of oil and gas has not slowed much. And overall the US economy remains on a modest recovery path supported by low energy prices, underpinning household spending.
The broad sentiment is that oil prices will remain at depressed levels for a number of years with a significant supply overhang.
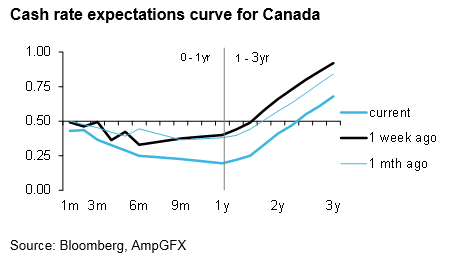
Expectation for BoC rate cut creeping up
The low energy prices have placed renewed downward pressure on the CAD; expectations are creeping higher for the BoC to respond to the fall in prices by cutting its policy interest rates (as they did in a surprise fashion at the beginning of 2015.)
The Bank of Canada decides on rates next Wednesday on 20 Jan, and releases its quarterly Monetary Policy Report, which makes this a key forecasting round for the Bank and raises the odds that it acts to bolster the outlook for the economy in the face of more pressure on its key export markets.
The BoC cut rates in the January last year in a surprise move by 25bp to 0.75%, for the first time since they raised rates to 1.0% in 2010; they cut rates again in July 2015 to 0.5%.
The odds of a cut next week were negligible at the beginning of the year, but have increased to about a 25% chance of a 25bp cut. The market is now pricing in a full 25bp cut by mid-year.
The CAD has already fallen sharply over the last month in line with the fall in oil prices. It has fallen by 6.8% since end-Nov against the USD and its trade weighted index, to its lowest level since 2003.
Has it fallen enough to reflect lower commodity prices? – is a question investors might ponder.
Weaker Canadian economic indicators increase odds of a cut
Some considerations that might sway the Bank of Canada to cut rates or at least hint that it is leaning that way is that recent manufacturing and economy wide PMI data are trading well below 50, pointing to a weak growth outlook. Unemployment while stable last month has crept higher in 2015 after bottoming at end-2014.
And a factor that might highlight a need for a weaker CAD is that the trade-balance is around its weakest levels on records in data available over 20 years (around -$2bn), noticeable weaker than a monthly surplus of near $5bn the last time oil prices were similarly low in the early-2000s. The current account balance was around a 2% surplus in the early-2000s, vs a deficit in the last year of around 3.5% of GDP.
The BoC last policy statement on 2 December was neutral saying “risks around the inflation profile remain roughly balanced”. Since this meeting, on-balance, most economic indicators have weakened and inflation was recorded a touch below expected although still near target at 2.0y/y in core terms.
Global growth uncertainty has arguably increased in light of the recent uncertainty generated by the Chinese market uncertainty and policy agenda and negative feedback to global equity markets.
BoC should endorse a weaker CAD exchange rate
The Bank will probably view the currency’s depreciation as providing a buffer for the deep fall in commodity prices. This may lessen the prospect of a rate cut, but the BoC should endorse the weaker CAD trend, and a rate cut is a distinct possibility as an insurance policy to bolster confidence in Canada and keep the currency on a weaker footing.
As the chart above suggests, in comparison to oil prices, the trade balance and economic growth momentum, the currency does not look exceptionally cheap.
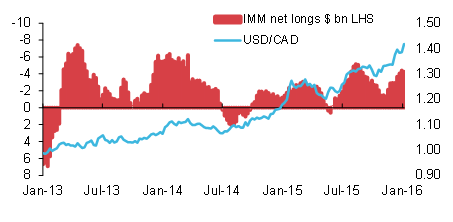
USD/CAD can rise significantly further
The pace of the USD/CAD rise, taking it rapidly to another multi-year high might discourage investors from buying it at current levels. And indeed it remains highly correlated to oil prices and subject to a risk that it snaps back with a correction in oil prices.
It is a volatile market and difficult to jump in to buy at these levels. Nevertheless, it is far from clear that the market is over-bought or that the USD/CAD cannot rise significant further. It traded mostly between 1.50 and 1.60 from around 2000 to 2003.
IMM futures positioning data shows the market is net long USD/CAD by a significant amount, but not as long as it was in August this year, or at previous extremes in 2013 and 2014.
AUD is also vulnerable to global commodity price rout
The AUD has also fallen in line with the recent rout in commodity prices and upheaval in Chinese markets. China’s policy actions to stabilize the CNY have helped support the AUD somewhat it recent sessions, offsetting the further decline in energy prices and weak industrial metals prices.
Unlike the CAD, the AUD is still above its lows in September last year. The Australian economy has performed better than the Canadian economy and has shown evidence of a more sustainable recovery over recent months, supported by its non-mining sectors.
However, some recent indicators have lost moment, including those related to the housing market, and recent PMI data. The further slide in commodity prices this year may well begin to creep into weaker business confidence across the economy.
Key data in Australia and China
Key data releases for the AUD are the employment data on Thursday, which has recently been significantly better than expected. The Chinese trade data today will also be highly scrutinized for further evidence of weaker Chinese commodity demand. Next week Chinese activity indicators will also be important.
While US equity markets were relatively stable on Tuesday, risk premia in US corporate bonds and emerging market bonds are at their recent highs, reflecting a high degree of risk aversion that should also work against the higher yielding AUD.
Economic News in the last week
Canada
Housing starts 173.0K in Dec, well below 200K expected, down from 212K in Nov. Single family starts down 0.1%m/m after falling 2.6% in Nov; down 2.7%y/y. Apartments fell 27.0%m/m in Dec after rising 13.8%in Nov, down -0.6%y/y. Both permits and starts were weak to end the year.
BoC business outlook survey: future sales steady at 16.0 in Q4 from Q3, stronger than 10.0 expected, up from 8.0 in Q3 and 4.0 in Q1. Inflation expectations shifted up in Q4.
BoC loan officers’ survey reported a tightening in credit conditions from 4.4 to 5.6 in Q4.
Job growth 22.8K in Dec, stronger than 10.0K expected, up from -35.7K in Nov. Three month average 10.5K, six month average 10.4K, 12month average 13.2K. Modest to moderate trend, somewhat slower in the second half of the year.
Unemployment rate unchanged at 7.1% as expected, up from 6.7% a year ago.
Building permits fell 19.6%m/m in Nov, below -2.9% expected, after rising 9.9%m/m in Oct. residential single home approvals fell 0.6%m/m, down 1.0%y/y, apartment approvals fell 33.7%m/m, down 16.0%y/y. Nonresidential approvals fell 22.7%m/m, down 2.3%y/y. Recent volatility increased by a rule change in Alberta, but the data may signal a weaker trend.
Australia:
Weekly consumer confidence eased from 116.3 to 114.1 last week, close to the average since 2011, somewhat below the longer run average.
Job ads fell 0.1%m/m in Dec, after rising 1.1%m/m in Nov, revised down from 1.3%. They rose 10.0%y/y, growing at around this strong rate through 2015. Dec was the first monthly fall since July after recent strong gains.
Retail Sales rose 0.4%m/m in Nov, as expected. They were revised up a touch from 0.5 to 0.6%m/m in Oct. Sales rose 4.3%y/y in Nov, trending around this rate over the last year. Apartments led growth in recent months, with house approvals down 0.3%m/m in each of Oct & Nov. The trend rate of growth for houses was +0.2%m/m in Nov.
PMI Construction fell from 50.7 to 46.8 in Dec. Three month average of 49.9.
New Zealand
Building Approvals rose 1.8%m/m in Nov, after rising 5.4%m/m in Oct; up 17%y/y (seasonally adjusted). The trend rate of growth was 0.6%m/m in Nov. Overall still growing at a moderate to solid rate.
USA
JOLTS job openings 5431 in Nov, below 5450 expected, firmer than 5349 in Nov, revised lower from 5383. Openings have eased modestly since a peak in July after rapid growth over the previous 18 months to a record since data available in 2001. Openings are up 11.2%y/y.
The job openings rate (ratio of openings to the sum of employment and openings) rose from 3.6 to 3.7, stable around this level since mid-year, around the high since 2001. The Quits rate (also a sign of labour market strength) was stable at 2.0, around the high since 2008. Overall the data still point to a strong labor market.
Small business confidence firmed from 94.8 in Nov to 95.2 in Dec, a bit above 95.0 expected. This is down from a peak of 100 in Dec-2014. It is firmer than levels earlier in the recovery before 2014 from 2010, but still below the levels prevailing before 2007.
The Fed Labour Market Conditions index rose 2.9%m/m in Dec, above 0.4 expected, revised up to 2.7%m/m in Nov from 0.5%. The index is based on 19 monthly indicators. The
UK
UK manufacturing production fell 0.4%m/m in Nov, weaker than +0.1% expected, after falling 0.4%m/m in Oct; down 1.2%y/y. Production peaked in March-2015.
NIESR GDP growth estimate was unchanged at 0.6% 3mth/3mth in Dec
BRC Retail sales rose 0.1% 3mth/yoy for like-for-like sales in Nov, weaker than 0.5% expected, after falling 0.4% 3mth/yoy in Oct. Non-food LFL sales slowed from +2.6% 3mth/yoy in Nov to +0.6% 3mth/yoy in Dec.
Trade balance GBP-3.17bn in Nov, a wider deficit that -2.70bn expected, narrower than
Japan
Current Account balance JPY 1.42 tn in Nov seasonally adjusted, a bit below 1.51 tn expected, down a bit from 1.49tn.
Bank lending stable at 2.2%y/y in Dec.
Ecowatchers survey current conditions 48.7 in Dec, above 46.6 expected, up from 46.1 in Nov. Outlook index at 48.2 in Dec, a bit above 48.0 expected, unchanged from 48.2 in Nov. Confidence has fallen from a recent peak of 54.5 in May 2015, and is below the 50-balance point for the index
India
Industrial Production fell 3.2%y/y in Nov, weaker than +2.0% expected, after rising 9.9%y/y in Oct. Manufacturing production fell 4.4%y/y in Nov, after rising 10.6%y/y in Oct. On a three month average basis, IP was up 3.5% 3mth/yoy, a low since June, down from +6.7% in Oct, a high since 2011.
CPI inflation 5.6%y/y in Dec, above 5.5% expected, up from 5.4% in Nov, a high since Sep-2014
On the Radar
USA
- 12 Jan Obama SOU address
- 13 Jan – Beige Book
- 15 Jan – Retail sales, PPI, IP/CU, UoM consumer sentiment
- 20 Jan – CPI
- 27 Jan – FOMC meeting
- 29 Jan- GDP Q4 advanced estimate
- 1 Feb – PCE deflator
Australia
- 13 Jan – Job Vacancies
- 14 Jan – Employment/ unemployment
- 15 Jan – Housing finance
- 27 Jan – Q4 CPI inflation
- 2 Feb – RBA rates decision
New Zealand
- 14 Jan – Retail sales card spending, Truckometer
- 18 Jan – REINZ house sales
- 20 Jan – CPI
- 28 Jan – RBNZ rates decision
- 1 Feb Treasury monthly economic indicators
Eurozone
- 13 Jan – IP
- 14 Jan – ECB account of the monetary policy meeting
- 15 Jan – new car regos, Trade balance
- 21 Jan – CPI final
- 21 Jan – ECB meeting
- 29 Jan – CPI advance estimate.
- 2 Feb – unemployment
UK
- 14 Jan – BoE meeting
- 15 Jan – construction output
- 19 Jan – CPI
- 20 Jan – employment/unemployment
- 22 Jan – Retail sales
- 28 Jan – GDP Q4
Canada
- 13 Jan – House prices
- 14 Jan – New Home sales
- 15 Jan – Existing Home sales
- 20 Jan – BoC rate decision
- 22 Jan – CPI
Japan
- 14 Jan – Machine orders
- 24 Jan – Trade balance
- 29 Jan – unemployment, CPI, IP, Household spending
China
- 13 Jan – Trade balance
- 10-15 Jan – Aggregate social financing
- 18 Jan – Property prices
- 19 Jan – IP, Retail sales, Fixed asset inv., GDP Q4