Chinese macro data weak, but property indicators much stronger
The panic in global markets in the first month of the year has reversed course and there has been almost as much panic to get back into the markets that people exited in the first place. Emerging market currencies are leading the charge higher boosted by a reversal of fortunes in the energy market, a change of scenery in China, and further policy easing in Japan and Europe.
A testament to the supportive power of the ECB policy announcement last week is a surge in European and USA corporate bonds.
US yields have been rising along with the rebound in global asset markets since 11 Feb, more so than other major markets, and even most developed market commodity currencies. This should eventually return to support the USD, although market sentiment towards the USD may take time to improve.
The weaker USD trend itself may be helping restore global investor confidence, creating better optics for those currencies that manage their currencies against a basket. For instance even though the CNY is at its strongest level against the USD since early-December, China’s official currency basket index is at a low in data publishes since the beginning of the year. A weaker dollar may lessen the size of foreign debt in many emerging currencies and help establish a rising trends in their currencies.
US energy market rebalancing supports oil prices but also points to stronger overall USA demand that may improve the outlook for the USD.
This week two key central banks outline their current policy stance. The FOMC again meets with the glare of the global markets focused firmly on how it describes the outlook for policy. The market appears to have presumed policy tightening has been put on a slower path to account for greater uncertainty in the global economy and lower inflation expectations. However, a good deal of that uncertainty has diminished in recent weeks. US data has been mixed, but crucially the labor market remains strong and on balance the risk may be leaning towards the Fed disappointing expectations of sounding more dovish.
The BoJ will also release a quarterly update and it is possible that it decides to further enhance its monetary policy easing, although after a disappointing result from its negative interest rate policy decision on 29-Jan, few anticipate they will cut rates further; at least at this stage. The BoJ is likely to be quite perturbed by the strength of the JPY since its NIRP. It may argue it wants to give the policy more time to work its way through the market, but indicate it is willing to cut again if it has to.
A beleaguered US dollar
Few currencies are not up for the year against the beleaguered USD that many had thought at the beginning of the year would be spurred on by a rate hiking cycle in the US that only began in December. The strongest currency year-to-date is the BRL (+10.6%) whose economy has been battered over the last year by falling commodity prices and political instability. Other highly volatile and energy dependent emerging currencies (RUB, IDR and MYR) are up over 5% year-to-date.
Gold has surged 17.8% this year, stronger than any currency, however its momentum has stalled in recent sessions as the market appears less concerned about seeking a safe haven and store of value from negative interest rate currencies and is seeking high-powered investment in beaten down and now rapidly rebounding emerging market and other commodity assets.
The bears are not beaten yet
The US Stock market has not quite made it back to flat for the year, down 1.1% as at the close of last week. But it has reversed most of 12% fall in the first month or so of the year. However, the bears will still be hunting. The stock market has had its two biggest corrections (drops) since the 2011 Eurozone crisis) in the space of only the last six months, and so far its record high is back in May last year. Its recent lows in Jan/Feb this year, were below the lows in Aug/Sep last year, so the market may still see the market in a developing down-trend since May last year. The S&P500 is now approaching some significant resistance levels.
The first is essentially the close of last year, which is also the low end of the range from March to July last year. To revert the market to a clearly more bullish mood the index needs to push through the highs established between the two market corrections in Q3 last year and early this year.

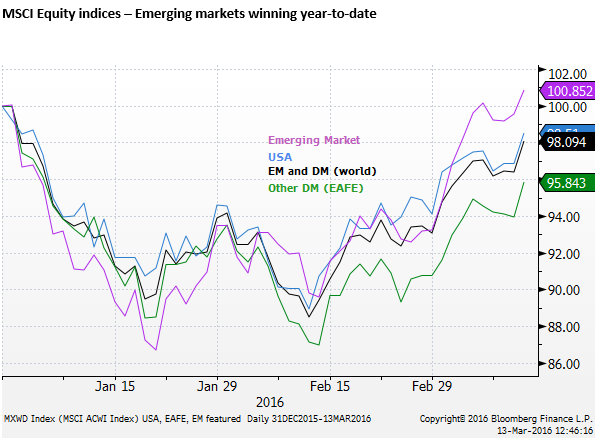
In USD terms, emerging market equites have out-performed the US and other developed markets since the beginning of the year, particularly since they bottomed out on 21-Jan, ahead of developed markets that bottomed on 11-Feb. The USA has out-performed other Developed Markets (EAFE: Europe, Australasia and the Far East).
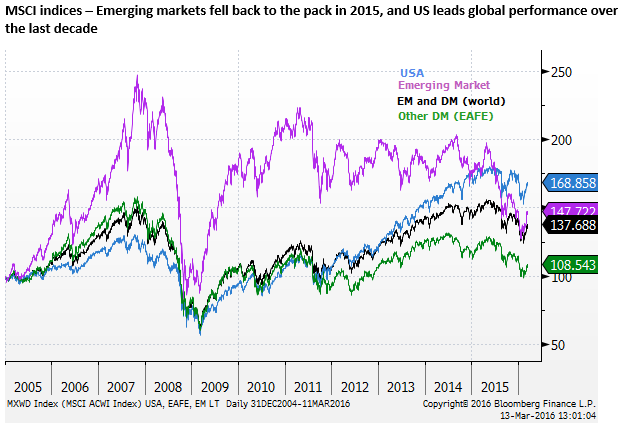
However, EM are recovering from a more severe beating in 2015
Over the last decade, the USA has been the strongest global market among these broad groups. While emerging markets have bounced more this year, they plunged more sharply than developed markets from the peak for the year in 2015 in May.
Interestingly, emerging and developed market equites, while diverging sharply for most of the last decade, have reconnected to show virtually identical performance over the decade.
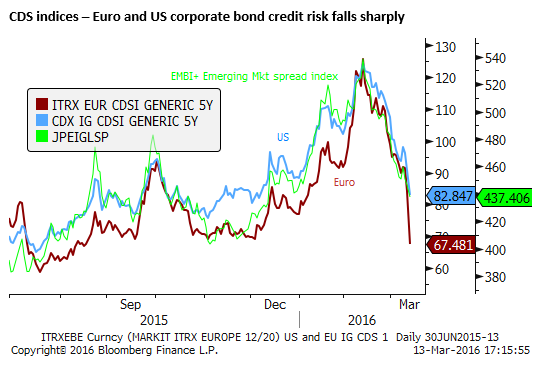
Corporate bonds sharp rebound will support global risk appetite
All measures of risk appetite – market implied volatilities and credit spreads – indicate a broad-based and solid recovery in the last month.
One noteworthy point is that corporate bond credit spreads fell more sharply than other measures of risk in response, it seems, the decision by the ECB last week to include investment grade corporate bonds in its asset purchases. While not specifying how much corporate bonds they would buy, they raised the total bond purchase amount from EUR60bn to 80bn per month.
The surge in corporate bonds could still filter into further strength in developed market equities.
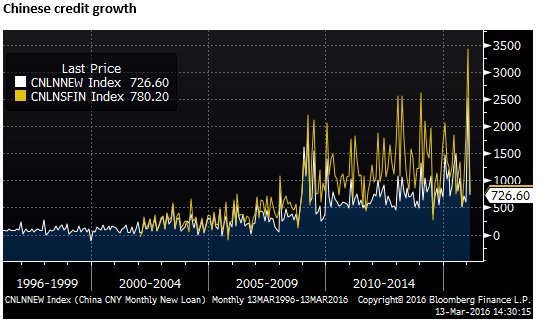
Subdued Chinese Macroeconomic indicators
After surging off the charts in January, loan growth fell back to more familiar levels in February. New bank loans were 723bn CNY (down from 2,510bn in Jan, below 1,200 bn expected.) Total social financing was 780bn (down from 3,417bn, below 1841bn expected).
M2 money supply growth, a key variable targeted by the government rose 13.3%y/y in Feb (down from 14.0%y/y in Jan, below 13.7% expected, but above the 2016 government target of around 13% for M2 and total social financing).
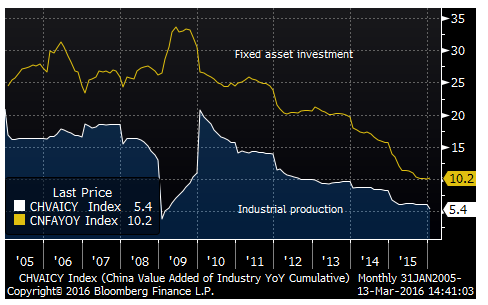
Industrial production rose 5.4%y/y in the first two-months of the year (down from 6.1%y/y in Dec-15, below 5.5% expected, a new cyclical low).
However, fixed asset investment rose 10.2%y/y in the first two months of the year (up from 10.0%for all on 2015 over 2014, above 9.3% expected).
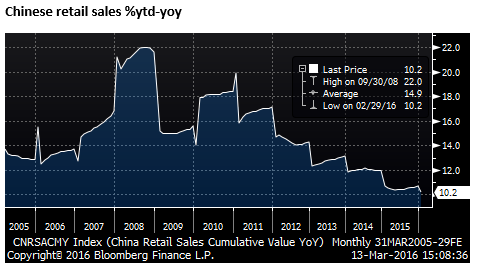
Retail sales rose 10.2% in the first two months of the year (down from 10.7%y/y in Dec, weaker than 11.0% expected, a new record low growth rate.
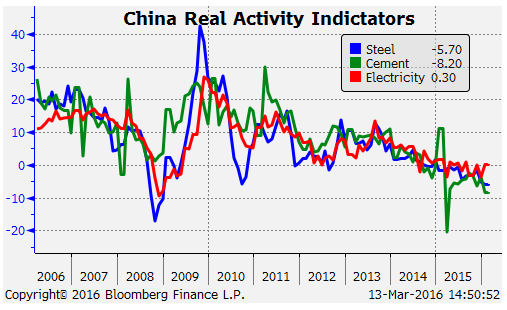
Output data for key heavy industry indicators appeared weak. Crude steel output fell 5.7%y/y in the first two months of the year, down from -5.2%y/y in Dec, a new low rate since 2008. Cement output fell 8.2%y/y, down from -3.7%y/y in Dec-15, a new record low. Electricity output rose 0.3%y/y, up from -3.7%y/y in Dec-15
Sharp rebound in Chinese property market activity to start the year
However, while on the face of it these data appear weak, except for fixed asset investment that rose more than expected, indicators from the property market were up sharply in comparison to last year’s pace.
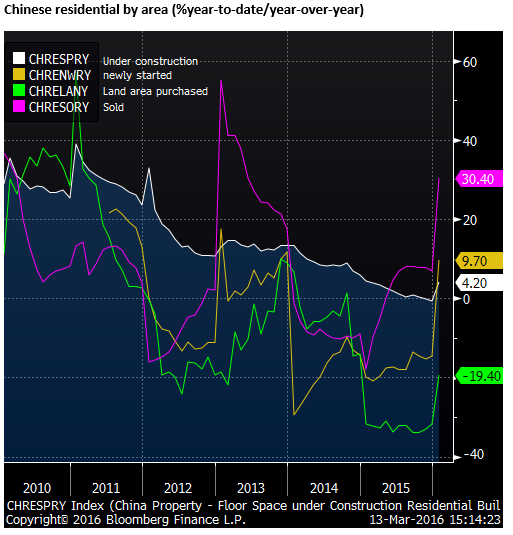
Residential floor-space under construction rose 4.2% y/y in the first two months of the year, up from -0.7% in all of 2015 over 2014.
Floor-space of newly stated residences rose 9.7%y/y in the first two months of the year, up sharply from a decline of 14.6% in all of 2015 over 2014.
Land area purchased was still down 19.4%y/y in the first two months of the year, although this was up from -31.7% in all of 2015 over 2014.
Floor-space of residences sold rose 30.4%y/y in the first two months of the year, up from a rise of 6.9% in 2015 over 2014.
The value of residences sold rose 49.2%y/y in the first two months of the year, up from +16.6% in 2015 over 2014.
Floor-space of residences completed rose 29.8%y/y in the first two months of the year, up from -8.8% in 2015 over 2014.
The data appear to suggest that the property market is off to a strong start this year on most metrics albeit from a weaker base set last year.
If the property market activity was to maintain this pace of rebound perhaps we should expect a rebound on the way in steel and cement output.
Chinese property price data are due at the end of this week, but several news reports have highlighted surging property prices in the tier one cities The price index for newly built homes in 70 cities rose 1.0%y/y in Jan-16, up from +0.2%y/y in Dec, the first increases in this remarkably smooth series since Sep-2014.
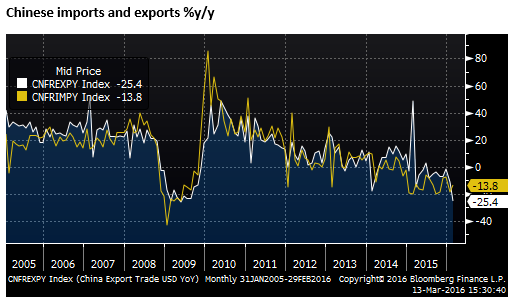
Last week China reported weaker than expected trade value data for both exports (-25.4%y/y, down from -11.2%y/y in Jan, well below -14.5% expected, almost matching the low in 2009) and imports (-13.8%y/y, up from -18.8% in Jan, below -12.0% expected).
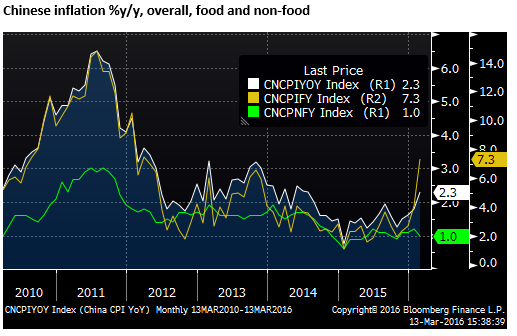
Chinese CPI inflation was reported up 2.3%y/y in Feb from +1.8%y/y in Jan. However, the rise was all in Food +7.3%y/y up from +4.1%y/y, while non-food was +1.0%y/y, down from 1.2%y/y, essentially stable around this rate for the last year, lower than the government’s CPI inflation target of 3.0% for 2016.
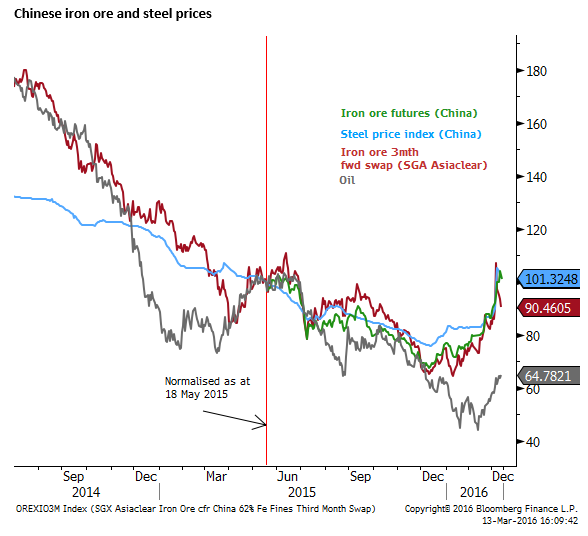
Steel and cement output in the first months of the year were weak, but iron ore and steel prices rose sharply in the last month, and bottomed around mid-December in China.
Some of this rise may well reflect the global upswing in oil, equities and most asset prices globally over the last month. It may also reflect stronger property market activity generating stronger order books for steel. Even though industrial production looked week, fixed asset investment was stronger, possibly also due to stronger residential construction activity and government infrastructure projects.
A third reason posited for the surge in iron ore prices was reported to be a surge in production underway ahead of a planned halving of production from late-April to October to reduce pollution in Hebei province ahead of an international horticultural exhibition according to an FT article China flower show fuels iron ore surge, 9 March – FT.com
The third reason would suggest we should ignore the current surge in iron ore and steel prices as short-lived. However, evidence of a stronger residential market and firmer fixed asset investment suggest the rebound in industrial commodity prices may be more sustainable.
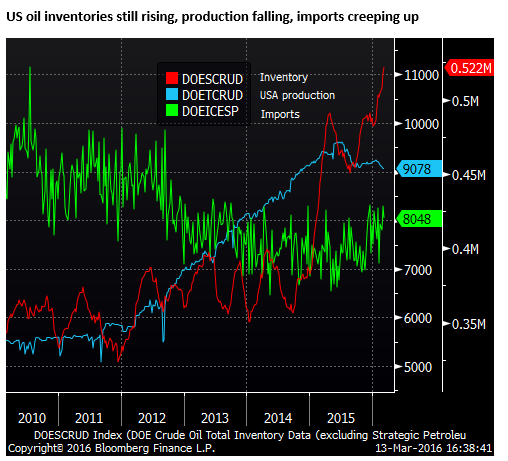
US Energy market leading global rebalancing
The energy market has had a remarkable turn of fortunes since the beginning of the year. We await a meeting that is supposed to take place between major oil producers on 20 March to see if they seal a deal that appears to have been struck to freeze production. However, a good deal of the surge in oil prices in the last week occurred as US oil production was reported to have fallen faster than expected and US gasoline demand was reported higher than expected. On the other hand, inventories of oil in the US still rose to new highs, highlighting that there remains a severe glut.


The International Energy Association (IEA) said that while it still expected supplied to outstrip demand until 2017, it now sees lower prices having a bigger effect on US shale output.
The IEA expects output from countries outside the OPEC production cartel to drop by 750,000 barrels a day this year, led by declines in US shale, against a previous estimate of 600,000 b/d.
Have oil prices bottomed? The international energy agency thinks so – AFR.com
An interesting feature of this surge in oil prices in the last week is that it shows a significant improvement in the balance of data coming from the US, higher demand and lower production.
On the demand side, it might also be a sign that the US economy may be poised for stronger activity data. High gasoline demand suggests that US consumers may also be spending more on other goods and services. If they are driving somewhere more than normal it presumably means they are doing so for a purpose that probably involves spending. This might be a good sign for US asset prices.