ECB and Fed QE reversal in play, Credit risk dampening CNY and EUR
The CNY has developed a steady downtrend. While this is often discussed in the context of political relations between the US and China, it may just reflect the fundamental realities. These include policy easing in China to offset credit tightening related to increased regulatory scrutiny on shadow-finance. Risk metrics in the Eurozone have deteriorated further; including wider credit risk premiums for periphery sovereign and corporate bonds. This appears to be contributing to a weaker EUR. EUR/CHF may have room to fall after diverging from wider Italian bond spreads in the last month. The rise in US real yields in the last two months appears to reflect, to a significant extent, a higher term premium. This suggests that the Fed’s balance sheet unwind may be starting to have a bigger impact, both supporting the USD and dampening global equities. The cost of hedging long EUR/USD positions over three-month terms is at a record high.
Chinese currency steady downtrend
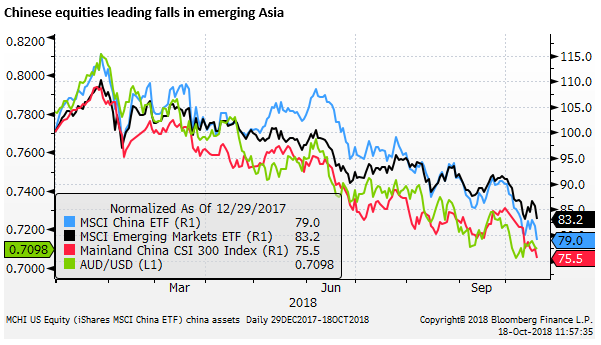
The CNY appears to be developing a steady downtrend. This would be consistent with a narrowing yield gap between the US and China, the dampening impact of an ongoing trade war with the US, credit tightening in China related to increasing regulation to rein in shadow-finance resulting in a less robust economy and more policy accommodation. The Chinese current account has also diminished.
The pace of decline in CNY is gradual and controlled by Chinese authorities. They wish to avoid a sense of panic that might cause excessive capital outflow, and unwanted tightening in financial conditions in China.

The slide in Chinese equities to new lows suggests that China’s policy easing is struggling to gain traction in offsetting credit tightening and other issues undermining investor confidence.
Risk aversion in Europe rises further
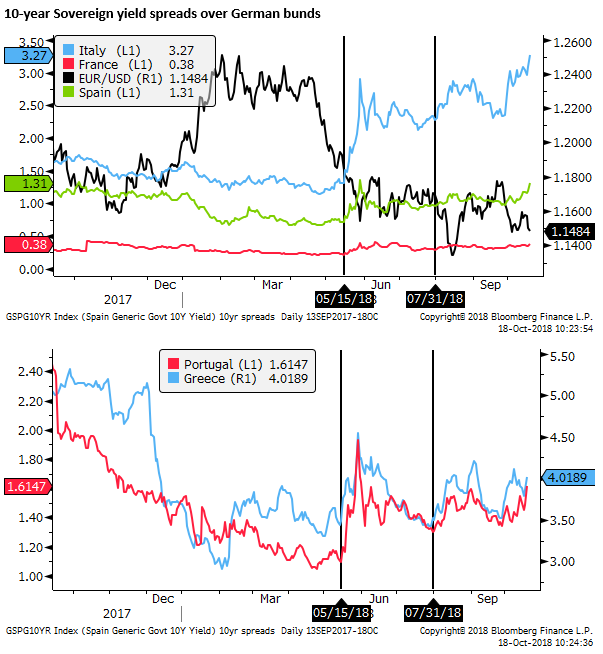
Risk aversion in Europe has also increased. Italian bond yields have risen to new highs, and the widening trend has also broadened to other Euro-periphery markets, including Spain, Portugal and Greece.
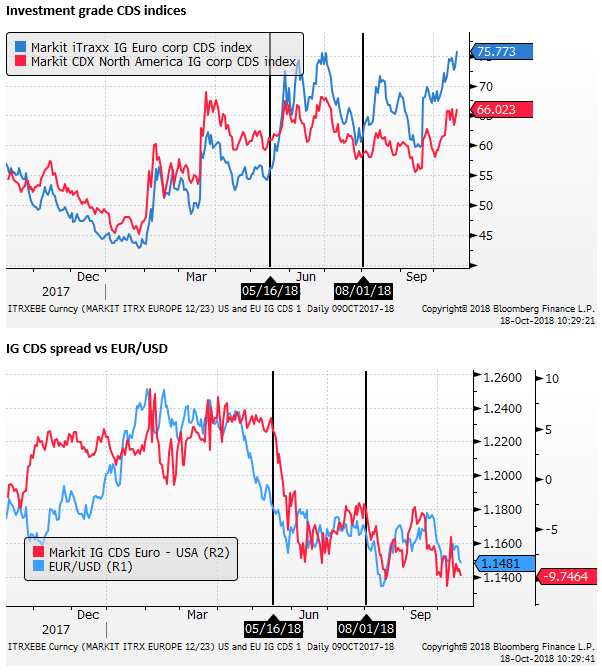
Corporate credit risk, as reflected in investment-grade credit default swap indices, has risen more in the Eurozone (to new highs for the year) than in the US. The spread between the two helps explain the fall and swings in the EUR/USD since May.
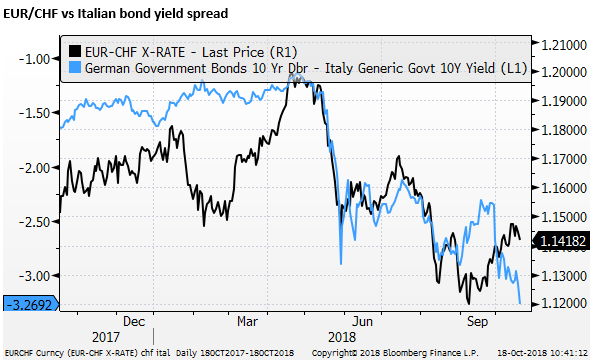
EUR/CHF may have more room to fall
EUR/CHF has diverged from the spread widening in Italian bonds over bunds in the last month. But appears to be responding (negatively) to higher risk aversion on Thursday. Technical resistance near 1.15 and heightened risk aversion associated with European budget issues, Brexit, stress on US-Saudi relations, and weak Chinese markets suggests more downside risk for EUR/CHF.
Central bank QE tapering may be playing a role
The budget stand-off between the Italian government and other EU leaders may be the key factor contributing to widening periphery spreads. But the further tapering in the ECB purchases since the beginning of October from EUR30bn to 15bn, well down on the peak purchase rate of 80bn per month in 2016, and expectations that this will fall to zero in January may be contributing to the widening trend.
Furthermore, the Fed’s net sales of government bonds may be placing upward pressure on US Treasury yields. We noted earlier this week that there has been a significant rise in real yields in the US in recent months. This rise may reflect increased confidence in the medium term growth rate for the USA, and increased net supply of Treasuries.
As yet there has been little upward pressure on German bund yields. This may reflect safe haven demand for bunds from the periphery, little evidence that the Eurozone economy has regained momentum since its retreat in the first four months of the year, and no clear signs of a pickup in core inflation in the region, still well below target.
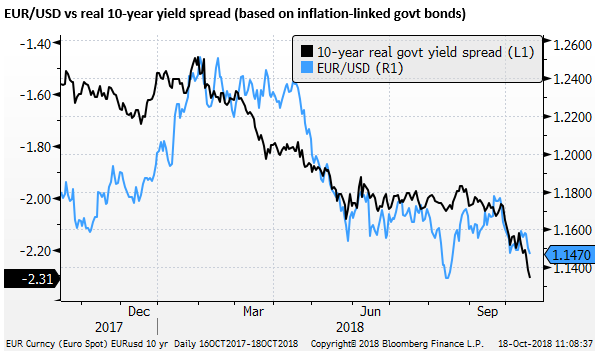
The fall in the real yield spread for EUR/USD deeper into negative territory may be contributing to a weaker EUR/USD exchange rate.
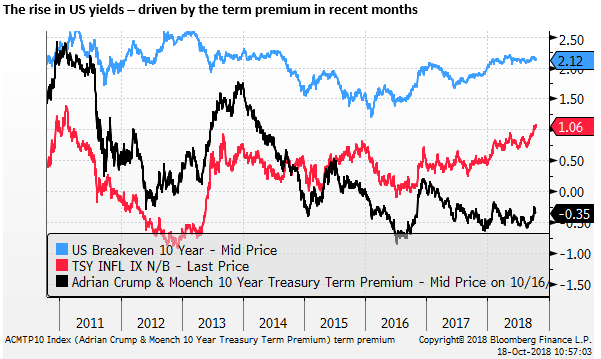
The chart below shows US real 10-year yields, 10-year inflation break-evens and the Fed’s estimate of the term premium. It illustrates that all of the recent increase in US yields reflects a rise in real yields. Stable inflation breakevens suggest there has been no significant increase in inflation expectations.
The term premium remains historically low, still in negative territory, but it has increased by around 20bp since end-August. Over the same period, real yields as measured by inflation-linked bonds have risen by 30bp. This suggests that around two-thirds of the recent rise in yields may reflect a higher term premium. This supports the notion that a higher net supply of bonds, driven to a significant extent by the Fed’s policy of running down its balance sheet, has been a key factor recently in pushing up US yields.
The implied tightening in monetary conditions, pushing up real yields in the US may be contributing to a stronger USD and weaker global equities.

Higher 3mth USD carry return
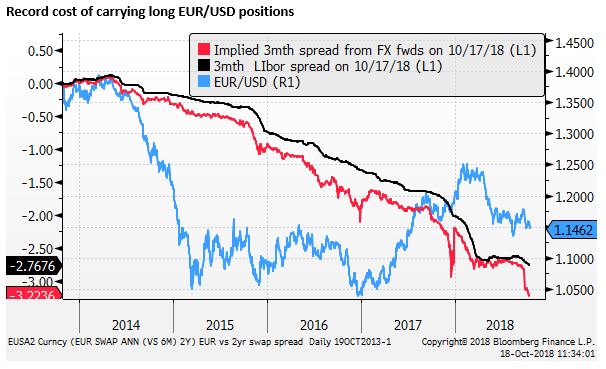
An additional factor that some commentators have noted could be affecting markets is the rise in the cost of hedging USD over a three-month period. This may dampen hedged foreign demand for US bonds, increasing upward pressure on yields. But it also encourages unhedged demand for US bonds, and in general increases the carry return from long USD positions.
The chart below illustrates that the cost of hedging USD positions over three-month terms typically does increase at the beginning of the fourth quarter (when the three-month period covers the turn in the calendar year). However, the spike lower in 3mth cross-currency basis swaps (a key component of this cost) appears relatively large this year. The chart also shows that the hedging cost tends to rise further towards the end of the year.

The fall in cross-currency basis into deeper negative territory for other major currencies is not that noticeable in longer tenors. The chart below shows the same chart for 1-year x-ccy basis swaps. This suggests that the apparent ‘shortage’ of USD liquidity is not as severe as it may seem. However, 3mth tenors do tend to be favoured in hedging strategies by fund managers, and it is possible that this spread widening on this shorter tenor may help support the USD.

The chart below shows that the implied three-month cost of carrying a long EUR/USD position is around an annualized 3.22% (incorporating the wider x-ccy basis), larger than the 2.77% differential in 3mth interbank rates. This is the highest cost of carry on record since at least 1998.