EUR lifts as its assets out-perform, AUD still looks cheap and has the trade surplus to prove it
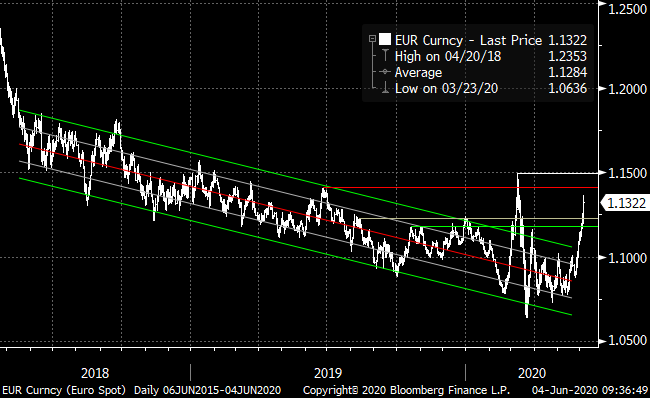
EUR spikes above a 2-year downtrend
Volatility in the EUR has picked up around the COVID crisis. It popped and dropped in March, breaking above its previous two-year downtrend, but then returned to that trend through April/May. In the last week, it has again broken above the previous downtrend. The context this time appears more sustainable, occurring after the big policy decisions have been made in response to the crisis and investors have had time to move their horizon beyond the immediate need to contain risk in their portfolios.
EUR may be breaking out of down-trend – Support (1.118, and 1.123); Resistance (1.141 and 1.150)
Despite broad weakness in the USD, JPY has fallen further than the USD in the last few days. To some extent, this reflects a diminished demand for safe-havens; although, on Thursday, equities edged off their recent highs, and the JPY still weakened to above 109 for the first time in around 2-months. This has contributed to a bigger rise in EUR/JPY over the last week, rising above a previous downtrend line over the last two years. This may further support the notion of stronger support for the EUR developing.
EUR/JPY rises above a down-trend line: Resistance (123.50/70) Support (122.85 and 121.45)

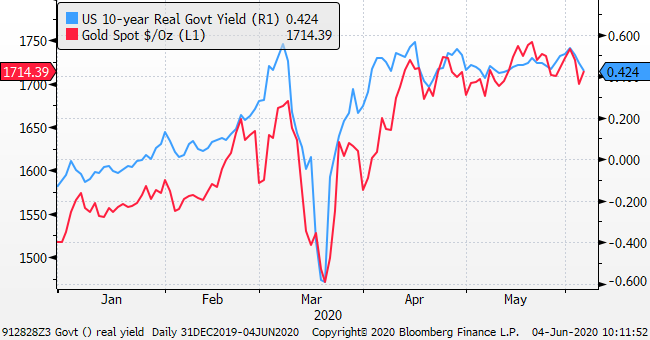
While JPY is moderately weaker in recent days, gold has remained little changed, rising on Thursday, reversing losses on Wednesday. The surge in equities over recent weeks might have been expected to weaken gold in response to diminished safe-haven demand. The stability of gold around its highs since 2012 points to underlying weakness in the USD, and indeed in all currencies. Low and negative real yields, pressed down by central banks’ low rates and QE policy, reducing the opportunity cost for holding gold, are underpinning gold demand.
That said, real US bond yields have risen in recent days. The further rebound in equities now appears to be placing more significant upward pressure on yields.
Gold vs US 10-year real yield (inverted) (from inflation-linked government bonds)
AUD and NZD continue to press higher
Broad weakness in the USD has developed in recent weeks, but the USD was overall mixed on Thursday.
In this respect, the modest further gains in the AUD and NZD on Thursday were notable. They came despite some consolidation in equities, little change in CAD, modest declines in Latam currencies and mixed Asian currencies.
The AUD and NZD have surged in the last week arguably leading a slump in the USD and out-performance in most commodity currencies. Both are flirting with key psychological levels (0.70 and 0.65 respectively).
Furthermore, the AUD is within striking distance of making a high for the year; it started the year at around 0.70, a 5-month peak for the currency at that time. Its surge in the last week came after a break above key resistance at around 0.668 that should now serve as a support.
AUD/USD – surged after breaking above 0.668; approaching key resistance 0.7000/0.7030

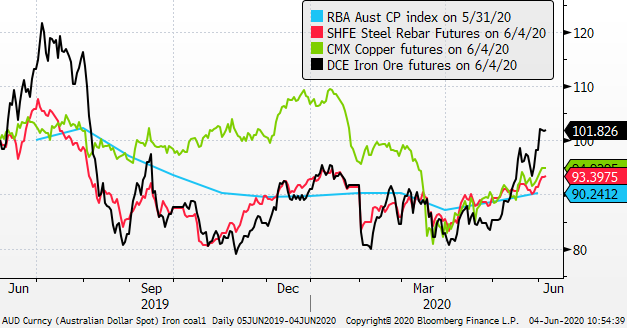
The gains in AUD and other commodity currencies in recent months is supported by a recovery in commodity prices. Industrial metals prices have broadly recovered from their lows around March/April.
Industrial metals prices in USD terms
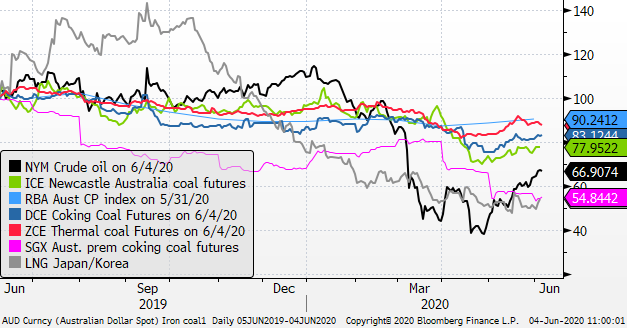
Energy prices have been more mixed. Oil prices have recovered partially from steep falls in Jan-Apr. Most coal prices have also improved modestly in-line with oil. However, Australian coking coal and Asia LNG prices remain near lows.
Energy prices in USD terms
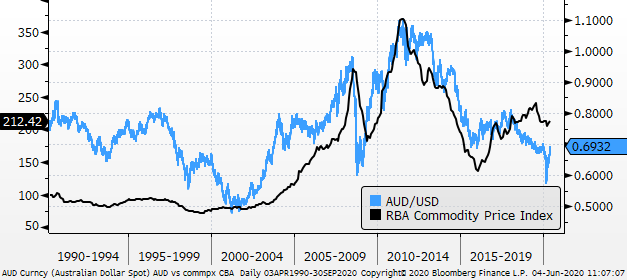
The monthly RBA commodity price index has remained relatively stable this year. The AUD is also now largely back to where it started the year.
AUD looks cheap relative commodities
From a longer-term perspective, the AUD still appears to be relatively low compared to commodity prices. Commodities are down from a recent peak in mid-2019, but are well up from their low in 2015. The AUD has been in a downtrend since the beginning of 2018, despite a rising trend in commodities, and is still around its lows in 2015. Its historic relationship with commodities suggests that the AUD might be fairly valued around 0.75/0.80.
AUD/USD vs RBA Commodity price index in USD terms
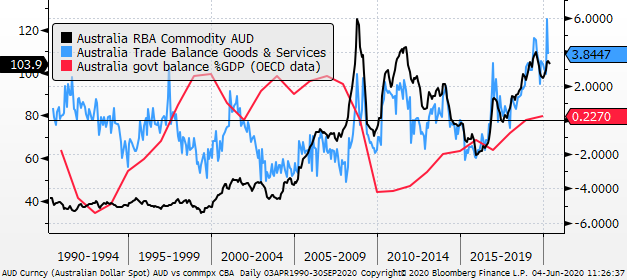
Australian Trade surplus at record highs
The relatively low level of the AUD compared to commodities has pushed the commodity price index in AUD terms to around previous long term peaks. This is contributing to stronger export revenues and a larger trade surplus. The trade surplus has risen to record highs as a percentage of GDP in the last year, also boosted by higher volumes after the resources investment boom around 2010/15.
The trade surplus was reported on Thursday, again above expected in April, equal to around 3.85% of GDP. The surplus has been maintained despite reduced global demand for Australian goods and services during the COVID crisis, suggesting that it is robust and will be ongoing support for the AUD.
Australia had a persistent trade deficit of around 4 to 6% of GDP for decades up to around 2005. During this era, AUD stability generally required a higher yield to attract capital inflow and sustain external balance. Looking ahead, the AUD may no longer need a higher yield for stability, and its higher trade surplus may contribute to a stronger AUD.
High commodity prices in AUD terms is helping boost the Australian trade surplus
Canada and the US reported wider trade deficits
On Thursday, in contrast to Australia, Canada reported a wider than expected trade deficit, and the USA reported a wider deficit, reversing the narrowing over recent months.
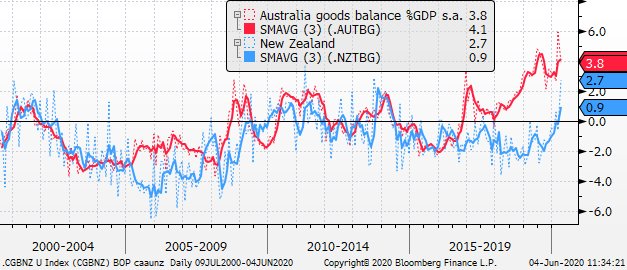
Both Australia and New Zealand have experienced an improvement in their trade balance in recent months. The goods balance for both were in surplus in the three months to April. In contrast to little significant improvement in the deficits in Canada or the USA.
Australia and New Zealand goods trade balance %GDP
USA and Canada Goods trade balance %GDP

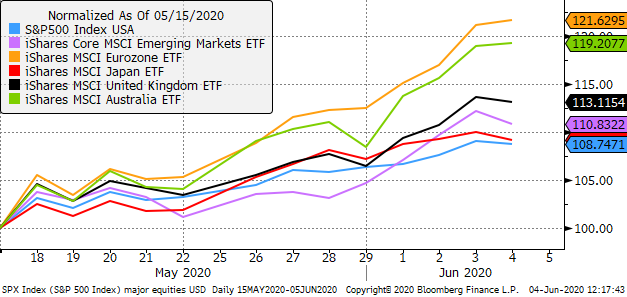
Australian and Eurozone equities out-perform since mid-May
In USD terms, the equity markets in Europe and Australia rose further on Thursday, extending their out-performance of other major and EM markets. Gains on Thursday and over the last week have been driven by currency gains. But it is a sign of investor confidence that the equity markets in both have sustained gains as their currencies have appreciated.
Major country and EM ETFs trading in the USD
QE is the new black for currencies
The EUR rallied and was expected to do so on a larger than expected increase to its QE program on Thursday (+600bn to 1.35tn until at least June-2021).
This is a turn around from years earlier when more QE was seen as a negative for a currency. QE is designed to depress real yields across the curve, and lower relative yields should depress a currency’s exchange rate. However, since everyone is engaged in this activity, relative yields don’t matter as much.
More QE is intended to boost asset prices, and in the case of the ECB’s actions on Thursday it has helped drive up periphery government bond prices significantly; Italian 10 year bond yields fell 13bp, whereas German bund yields rose 3.5bp. It has been effective in boosting asset prices and this may have increased demand for the EUR over other currencies.
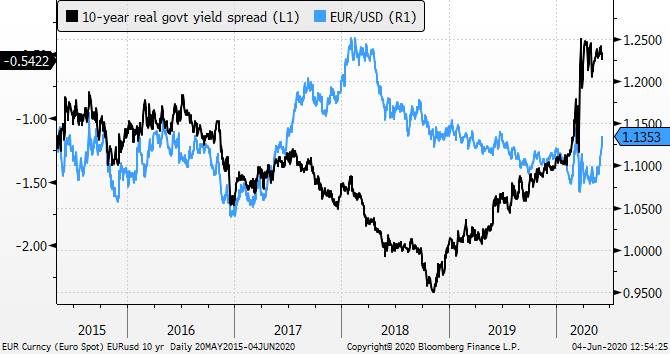
While real yield differentials may matter less, USA real yields have fallen much more than German and most other currencies’ real yields over the year-to-date as the Fed slashed rated and ramped up QE in response to the COVID crisis. The ECB’s actions have had limited further impact of real EUR rates. As such, EUR could have significantly further to rise to reflect the earlier narrowing in its yield disadvantage.
EUR/USD vs the real 10-year yield differential