Fed on the QT, market still digesting the BoE rate guidance
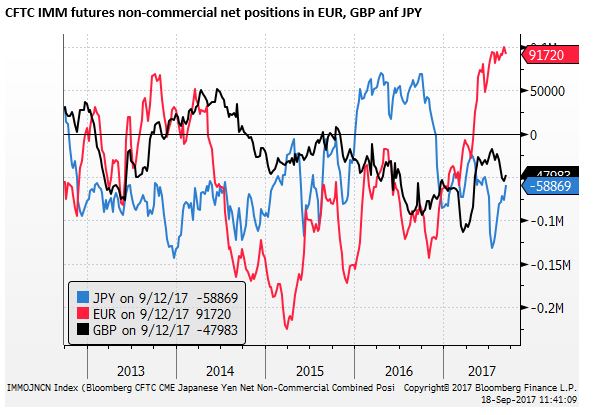
Even though the Fed’s QT starts gradually, the market may react to the prospect of it increasing in pace and resulting in a significant additional supply of bonds over the next two to three years. ECB and BoJ QE may have delayed the impact of impending QT on yields, but the ECB is expected to begin to taper next year. Improving global growth confidence and strong equity markets, including emerging markets, may also contribute to higher global bond yields. A renewed focus on US tax reform and calmer rhetoric on North Korea may further support US yields and the USD; in particular against JPY. The US rates curve remains relatively flat with less than two hikes priced in by end 2018, against the current FOMC dot plot for four. The Fed may appear somewhat more reticent to hike. However, we see limited scope for a downward revision to its rate projections. Recent evidence suggests that the labor market has tightened further, financial conditions remain easier than when they started hiking, and the weaker USD this year should help underpin its inflation outlook. The market is still coming to terms with the message from the BoE that hikes are likely. Positioning is still significantly short GBP and the BoE sees a weak GBP as the main culprit driving up inflation and the need to hike.
Fed on the QT
The Fed is widely expected to announce a start date for its QT on Wednesday, probably from the beginning of October. The pace of QT was pre-announced at the June FOMC, and the Fed has carefully managed to remove any surprise in this announcement.
The pace of QT will start relatively slowly ($10 bn per month) and increase quarterly next year.
The QT will operate with a monthly cap on the amount of outstanding assets that are run-down. The run-down will be conducted only by decreasing the amount of re-investment of maturing bonds (not sales of bonds). When it starts, the cap will be $6bn Treasuries and $4bn Agency bonds ($10bn in total) per month. Every quarter the cap will rise by $10bn until it reaches $30bn Treasuries, $20bn Agency MBS, and $50bn in total per month. The peak pace of QT will not be reached for 4 quarters (Q4-2018).
However, the caps are not likely to be binding once they are fully phased in, except for Treasuries in the middle month of each quarter when maturities spike, or if yields fall and generate a surge in Agency MBS refinancing (i.e. early repayment).
NY Fed President Dudley said in a speech on 7 Sep that “The program has been designed to be implemented gradually and predictably so that market participants and the U.S. Treasury can anticipate when and at what pace the portfolio is likely to run off over the course of normalization.”
“Reducing the size of the balance sheet is another form of monetary tightening, one with which we have little experience. This suggests we should proceed with caution.”
“Assuming that this process begins later this year and continues uninterrupted, the balance sheet size would likely normalize in the early part of the next decade.” (In around three years or so).
“Based on New York Fed staff projections, I would expect the Fed’s balance sheet, which currently stands at $4.5 trillion, to shrink by roughly $1 trillion to $2 trillion. This compares to an increase of about $3.7 trillion in the wake of the financial crisis.” Dudley anticipates that the Fed will aim to hold considerably more reserves than prior to the Global Financial Crisis, in part to allow it to continue to target the Fed funds rate using a corridor system, with a floor rate on excess reserves held by banks at the Fed.
The U.S. Economic Outlook and the Implications for Monetary Policy – NewYorkFed.org
So far, the prospect of QT has had little obvious impact on the US yield curve. Presumably, it could course the curve to steepen, by adding to the supply of securities that are held in private hands. And increasing the term-premium (the additional yield investors should require to hold long-term bonds to compensate for the uncertainty that rates may not evolve as expected). The term premium has been estimated to be at historical lows, and by some measures, below zero.
Treasury Term Premia – NewYorkFed.org
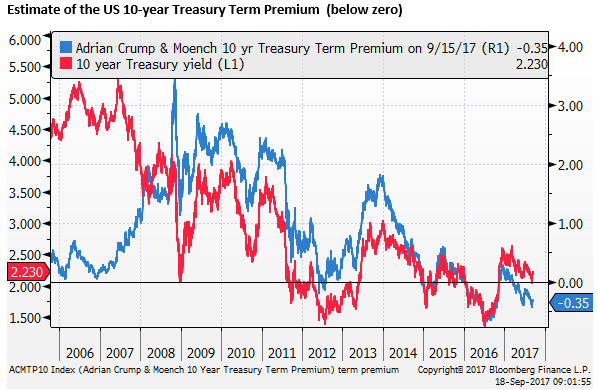
Even though the QT starts gradually, the market should be reacting to the prospect of it increasing in pace and resulting in a significant additional supply of bonds over the next two to three years.
Supply of bonds on the rise
The ongoing QE being conducted in the Eurozone and Japan may be keeping the term premia and bond yields low. However, The ECB is expected to taper from next year. The BoJ is conducting yield curve control; at the moment, in light of relatively low global bond yields, this is s requiring a lower pace of QE purchases than its target. As such, we need to be wary that QT may cause upward pressure on bond yields, at some point, especially if confidence in the global economy continues to build.
Fed research estimates that at its peak the Fed’s QE pushed the term premium down by 100bp. Due to a shortening in the duration of the portfolio, they estimated in April that this downward effect on the term premium would ease back to 85bp by the end of this year. As the Fed begins QT, this effect is forecast to fall further, although it will not reverse completely since, as discussed above, the Fed may prefer to maintain a higher balance sheet in the long run, in order to continue to use a corridor/floor approach to targeting the Fed Funds cash rate.
BoE’s Mark Carney discussed the likely increase in the term premium for global bond markets in his speech today.
[De]Globalisation and inflation – BankofEngland.co.uk
Referring to the Fed study above, he said that “Fed staff recently estimated that balance sheet normalisation could ultimately lead to a 75 basis point rise in the 10- year term premium. According to the July Primary Dealer Survey, the median expected rise in the 10-year US Treasury yield over the next two years due to a reduction in the balance sheet is around 30 bps.”
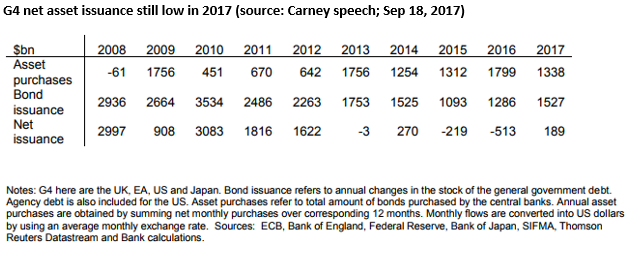
He also included an interesting table (below) that illustrates how QE by the G4 (FED, ECB, BoJ, & UK) absorbed more than net issuance of their countries’ government bonds, by a peak margin last year. The net supply of government bonds to private sector investors is likely to continue rising in coming years as Fed QT begins and ECB and eventually BoJ QE is tapered.
Limited scope for the market’s US rates outlook to fall
The Fed is not expected to raise rates, but their forecast profile for rate hikes will be watched closely.
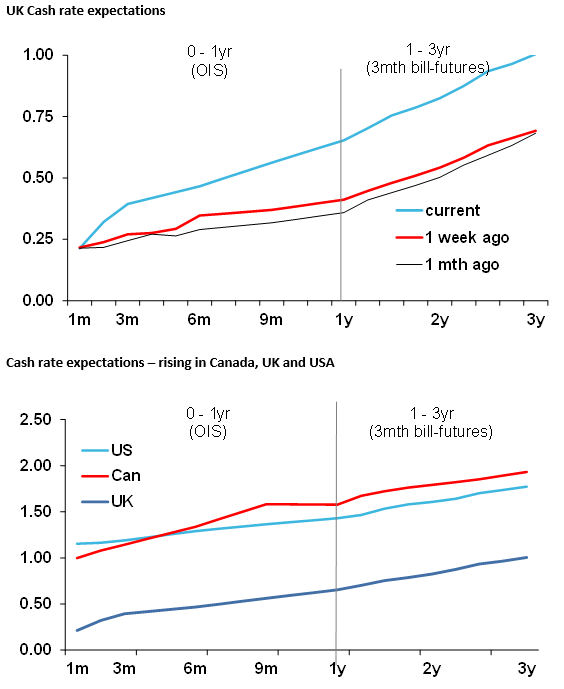
The chart below shows that while the probability of a hike this year, in December, and more across the curve have lifted in the last week, they have only recovered lost ground since mid-year, and are down since the peak following the March-FOMC. Bloomberg calculates the probability of a hike in December at 50%, the OIS curve has 14bp (56% of one 25bp hike). By the end of next year, the OIS curve has 40bp of hikes, less than two hikes.
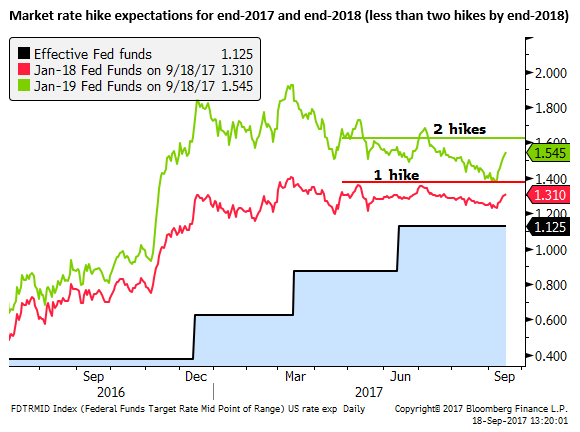
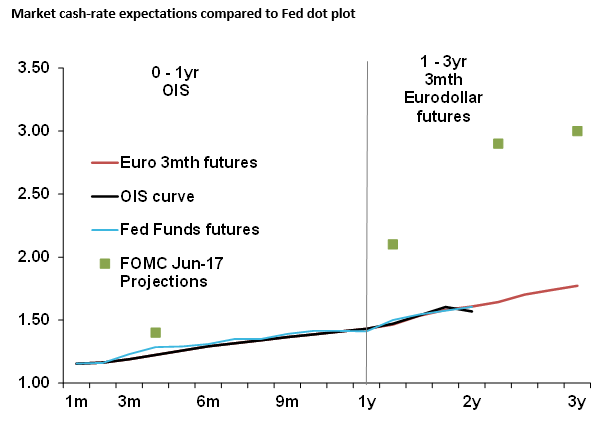
In June, the FOMC projected a further hike this year, and three more next year (four by end-2018), compared to less than two currently priced by the market. It has been typical for the market to price fewer hikes than the Fed over its horizon. This gap narrowed in March this year to be almost no difference, but it has widened out again.
(source: Bloomberg, AmpGFX)
The market, presumably, is betting that the Fed will lower its rates projections. It does appear that Fed member comments since June have acknowledged more concern that the fall in inflation since Q1 is not all related to idiosyncratic temporary factors.
As they approach the beginning of QT, the market is sensing that the Fed will raise rates more cautiously. The hurricanes may cloud the outlook near term and warrant waiting a little longer before further tightening. Wage growth has been stubbornly low, perhaps leading to some thought that the labor market can tighten further. The outlook for tax reform of fiscal stimulus has become less certain over the course of this year.
The market may also be paying less attention to the Fed’s dot-plot, since there is a significant change of Fed leadership anticipated next year. There are a number of Board places to fill already, and Yellen’s term is up in February. The market may sense that Trump will lean towards choosing candidates that are less inflation hawks and more growth-friendly.
Overall it seems the outlook for rates is less certain, and in the past, when there has been any doubt, the Fed has erred on the side of delaying and hiking less.
On the other hand, GDP was revised up in Q2 from its first estimate of 2.6%to 3.0% saar q/q; as was Q1 from its initial estimate of 0.7% to 1.2% saar q/q. Before the Hurricanes struck, the US economy appeared to be building momentum, and confidence readings remain high.
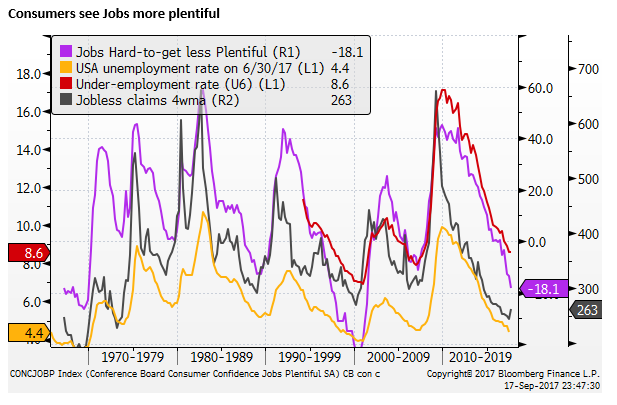
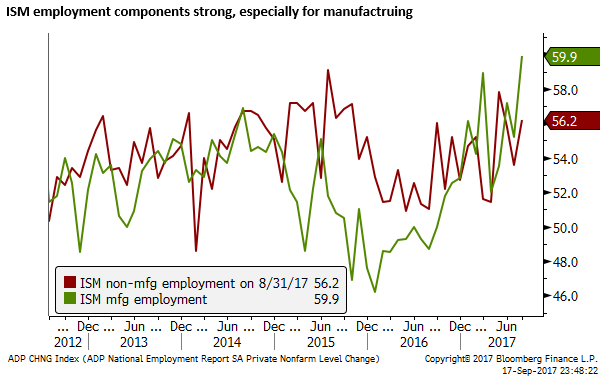
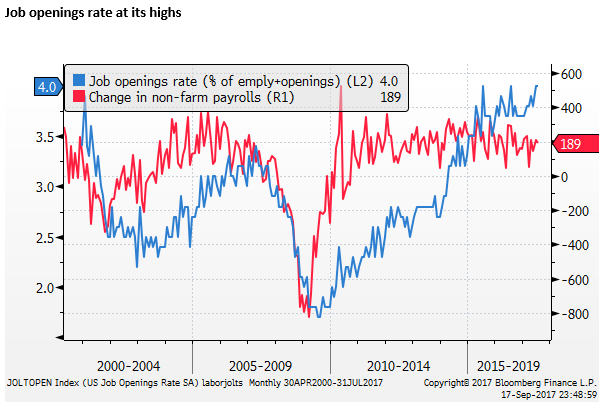
Employment indicators, including JOLTS, jobless claims, components of ISMs, and Jobs-hard-to-get-less-plentiful in the Conference Board consumer confidence survey all suggest significant further tightening labor market.
The latest CPI report last week showed some modest uplift in inflation. Global growth appears more robust and the USD is weaker this year, boosting the outlook for exports and import price growth. While the hurricanes will disrupt, it may also boost activity as replace, repair and rebuilding activity begins.

NY Fed President Dudley said in his speech on 7 Sep, albeit ahead of hurricane Irma, that “Although I expect that the Texas floods will make it more difficult to assess the economic data in the months ahead, I do not expect it to fundamentally alter the underlying trajectory of the national economy.”
In recent weeks, the Trump administration has made strides in rebuilding market confidence that it may be able to deliver reform and avoid the constant roadblocks in Congress. As such, we may yet see meaningful tax reform over the next year. Although, the Fed may continue to tread carefully in anticipating a boost to its growth projections from tax reform and infrastructure spending.
Furthermore, financial conditions remain very easy in the US, arguing for the Fed to persist with policy tightening. Fed’s Dudley said on 7 Sep that, “All else equal, an easing of financial conditions may warrant a somewhat steeper policy rate path.”

As such, the Fed may not change its dot-plot too much. We expect that it will tend towards ambivalence over a hike at year end, with a split vote, and similarly, it could be split on the number of hikes next year, moving the outlook for rates down from three hikes to a split vote between two and three.
This should provide some modest support for the dollar as the market is pricing in less than two hikes by the end of next year. We expect the Fed to still have three to four hikes implied in its dot-plot.
The tone of Yellen’s press release may help emphasize that the outlook is well balanced, the hurricane impacts are unlikely to change the trajectory of rates, with near-term disruption giving way to a boost to growth next year, and further gradual policy tightening should be expected.
Bank of England gave us fair warning
The big news last week was the rise in UK yields and GBP on a more hawkish than expected BoE MPC statement. The tone of that statement suggests a hike is very likely at the next meeting on 2 November. We note that the market is still only pricing in a 60% probability (15bp) of a 25bp hike for this date. In our view, it is a virtual certainty, so even in this short-term context, there is potential for a further positive surprise for GBP.
Through to the end of 2018, the market has a bit more than two hikes in the curve. This is still relatively modest in light of the assessment of the BoE MPC and this is likely to be reflected in its nnflation forecasts in November.
At face value, we should not be surprised by the hawkish turn, unemployment at 4.3% is a 40 year low and inflation is running around 3%, above the 2% target. Reading between the lines, the 14 Sep MPC statement suggested that a hike seemed appropriate, and the intent was to give the market a heads-up; meaning it will probably happen next time.
(source: Bloomberg, AmpGFX)
A weaker GBP key to BoE hawkishness
While the GBP appeared to correct lower after BoE Carney’s speech today, if anything he further emphasized the need to hike. He indicated that the inflationary impact of the fall in the GBP was a key factor in this decision.
An interesting feature of this discussion is that the reason to hike it is not so much because the UK economy is strengthening. In fact, while it is a bit better than previously forecast, it is significantly lagging the recovery in the global economy. The reason to hike, more so, is because potential output growth in the economy is falling and expected to slow further as Brexit unfolds.
Carney’s speech today, called “[De]Globalisation and inflation” discussed how globalization has held down inflation and will continue to do so globally. The [De] part was about how Brexit represents a period of reversal in this disinflation trend now underway in the UK.
Carney discussed how important the fall in GBP is for the inflation outlook. He said, “With respect to the exchange rate, the effects of imported inflation are particularly important to UK inflation dynamics, given both the openness of its economy, the low degree of home currency invoicing and the relatively slow but significant pass through of large, persistent exchange rate moves.”
He provided some very specific estimates. He said, “Around 60% of persistent movements in sterling tend to be passed through into import prices and those changes in import prices are fully – if gradually – passed through into consumer prices. The total import content of final consumer goods and services is close to 30%, of which around half is due to the use of imported intermediates in production. A 10% change in the exchange rate would, therefore, be expected to increase import prices by 6% and the level of consumer prices by 1.6% eventually. About half of the increase in import prices is passed through within the first year, with full pass-through taking around four years to complete.”
In case you don’t quite get the message for rates, he said, “In other words, in the UK, large exchange rate moves create price dynamics that are relevant to the policy horizon.”
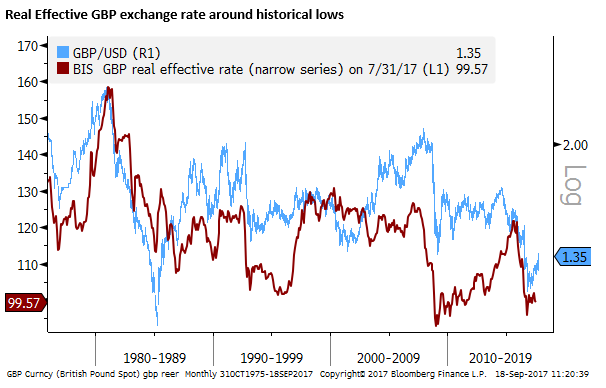
He noted that “The sterling ERI has depreciated by around 20% since the Brexit process became a possibility.” So based on his estimates above, this points to 3.2% boost to inflation (1.6% in year one, and the rest over the next three years.)
In effect, Carney is jaw-boning the GBP higher, implying that he will need to hike more if it does not.
Carney reiterated the message in the MPC on the need to hike rates as the trade-off diminishes between tolerating above-target inflation to support adjustment in the economy to the Brexit shock.
He said, “The latest indicators are consistent with UK demand growing a little in excess of the diminished rate of potential supply growth, and the continued erosion of what is now a fairly limited degree of spare capacity. If anything, recent developments suggest that the remaining spare capacity in the economy is being absorbed a little more rapidly than had been expected, and that inflation remains likely to overshoot the 2% target over the next three years.”
Medium outlook is not so rosy for GBP
On the other hand, the BoE is by no means painting a rosy picture for the UK economy. It anticipates a difficult and lengthy adjustment that will tend to generate weaker growth and higher inflation. This is not a particularly attractive proposition for asset prices in the UK, and suggests that the GBP should remain under-valued over the medium term. As such, we might expect a limit to how far GBP should rebound.
In the near term, market positioning is under-weight GBP and is still under-estimating the BoE’s rates outlook. This may keep GBP rising for a while longer.
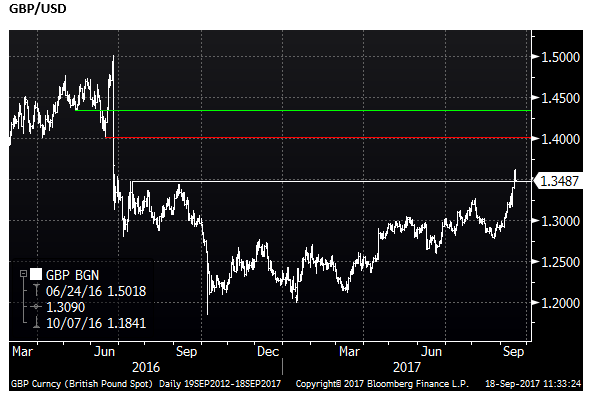
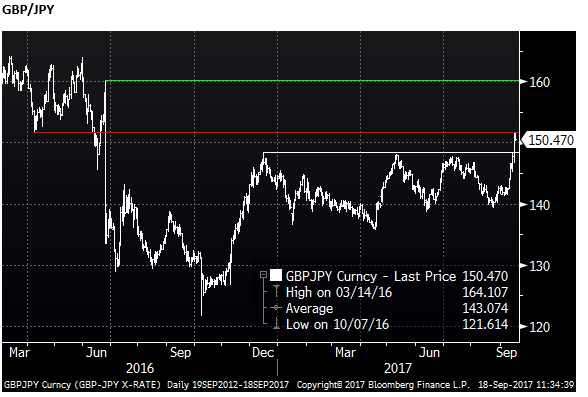
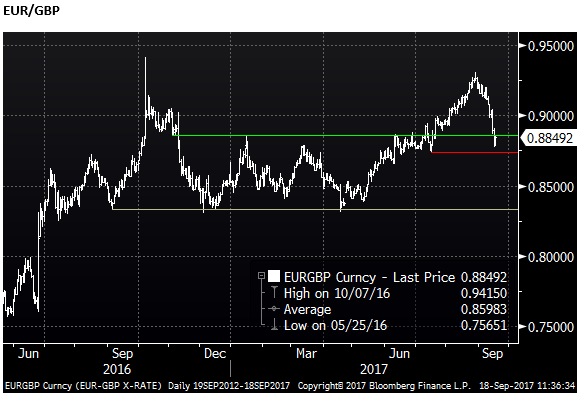
Technically, the GBP has broken key resistance levels, and there is now limited resistance until it re-tests its Brexit breakdown levels.