Fed vs. the data, Dudley writing calls on the S&P
US economic reports have significantly underwhelmed expectations in recent months. Confidence indicators may be ebbing, and the rebound in Q2 appears quite modest following a weak Q1. Inflation indicators have slumped in recent months. The Fed policy tightening stance now appears to rely almost solely on the labor market; if this were to lose momentum, the recent Fed hawkishness might be walked back. Dudley made it clear that easier financial conditions had boosted the case for policy tightening. This should be a warning to equity investors that the Fed may persist with policy tightening until asset prices lose upward momentum. Commentators and policymaker are starting to view low inflation outcomes as structural. Some central banks are shifting their focus surreptitiously from inflation targets to real interest rates and financial conditions. The RBA has accepted a lower glide path back to its inflation target, the Bank of Canada shifted to a tightening bias despite a slump in inflation readings, and the Fed is now more cognizant of financial conditions. A traditional focus on inflation targets may have boosted asset prices and built-in financial stability risks; recalibrating policy may see asset prices correct lower.
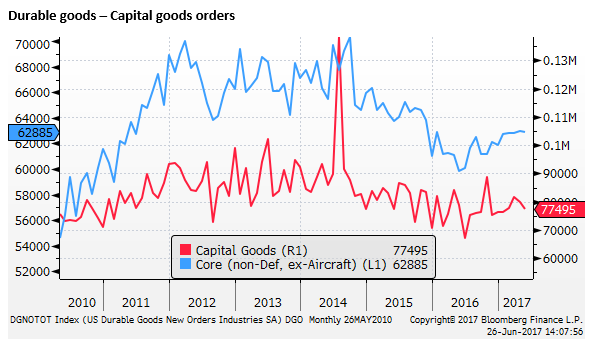
Weak US capital expenditure outlook
Core capital goods orders (excluding defense and aircraft) in the US have dipped for two months in a row in April/May, after a pretty tepid recovery from its low in June last year. The recovery is unconvincing.
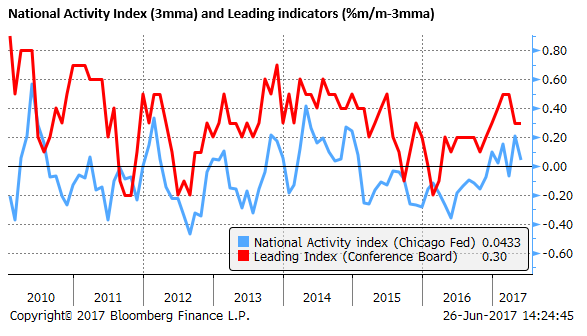
Below trend growth in May
The Chicago Fed National Activity Index (CFNAI), based on 85 national indicators, fell sharply below zero in May (from +0.57 to -0.26). It is constructed to have an average value of zero and a standard deviation of one. The fall below zero suggests economic growth was below trend in May.
The chart below shows the CFNAI vs. the Conference Board Leading Index (CBLI) monthly change. On a three-month average, the CFNAI is just above zero at 0.04. The data have firmed from around October last year, but have ebbed recently.
Consumer confidence may ebb
On Tuesday, in the US, the Conference Board Consumer Confidence report is released. The Preliminary University of Michigan Consumer Sentiment survey released on 16 June showed confidence slipping in June to a low since November last year. The weekly Bloomberg consumer comfort index also slipped last week to a low since February.
Overall consumer sentiment remains at a high level. However, we may be on the cusp of some correction in sentiment surveys. This would not surprise in light of the slipping credibility in the Trump administration and capacity of Congress to pass key legislation on health, tax and infrastructure.

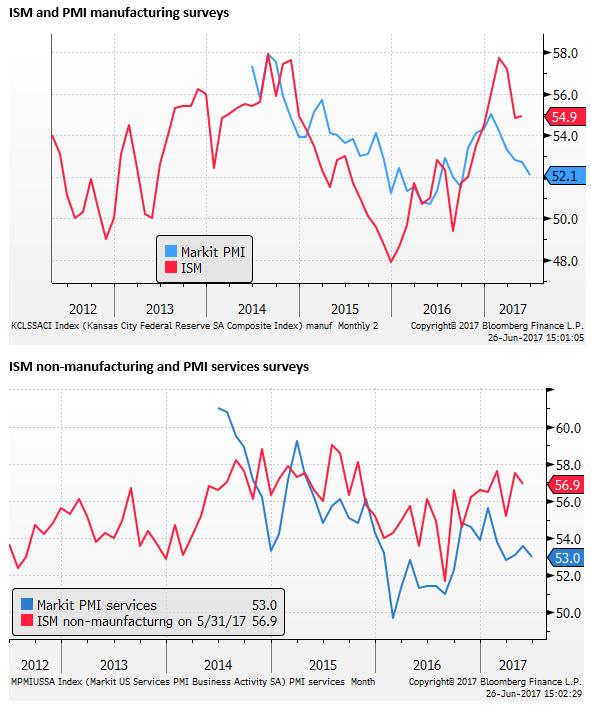
Hard data remains subdued
In any case, activity has not been boosted by strong sentiment surveys for either consumers or business. As mentioned already, durable goods orders show little pick-up in business investment.
The Markit PMI manufacturing data for June released last week showed a further fall from 52.7 to 52.1. The Market PMI services index was also modest at 53.0, little changed over recent months.
The charts below illustrate that the Markit data are weaker than the ISM PMI reports, and may suggest some downside risk to these more closely watched reports; reported next Monday 3 July.
Retail sales released two weeks ago fell in May and are exhibiting a modest growth trend. Excluding autos and gas, up 3.6%y/y. Some of this slowing in spending reflects weaker consumer prices.

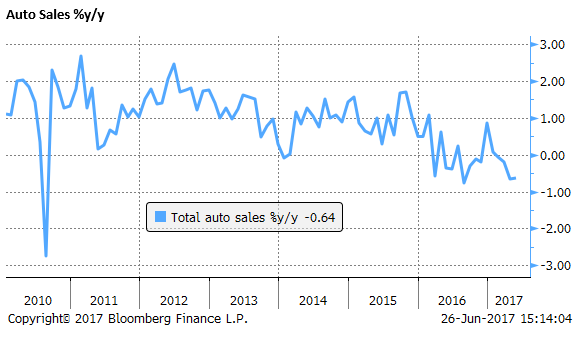
Auto sales have fallen sharply from a peak in December last year. Auto finance is reported to have tightened up this year as used car prices have fallen sharply. Auto sales for June are released on Monday 3 July.
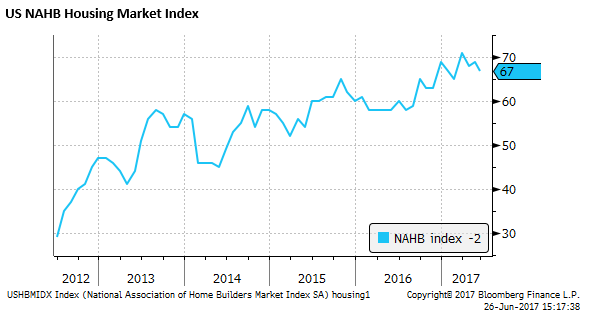
Housing showing stable growth
Providing more consistent strength in the US housing market, supported by falling long-term yields. The NAHB Housing Market Index was 67 in June, although below 70 expected, with a downward revision in May from 70 to 69, down from a peak in April at 70.
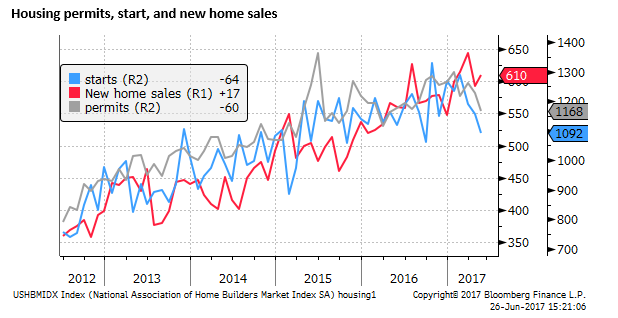
Starts and permits were also weaker in May, down for three and two months in a row respectively. New home sales, however, firmed in May and were stronger than expected, although down from their peak in March.
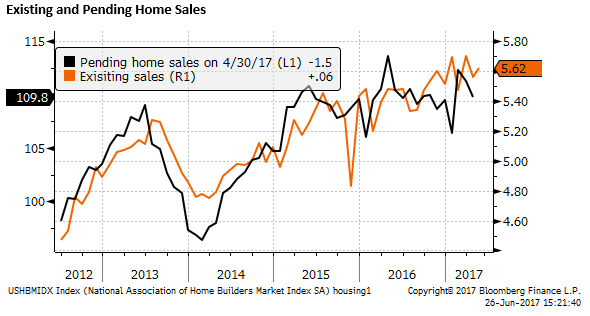
Existing home sales were firmer than expected in May, although largely stable since November last year. Pending home sales for May (a leading indicator of existing sales) is due on Wednesday 28 June.
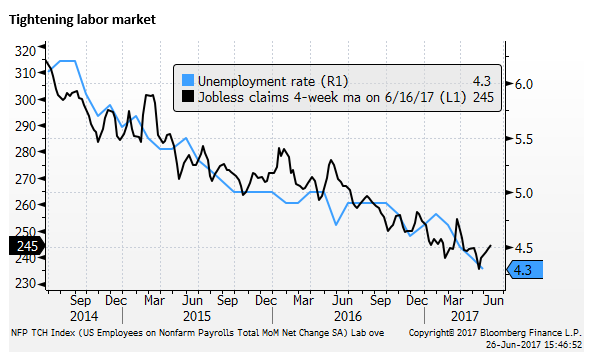
Labor market tighter
The labor market is probably the most important indicator underpinning the Fed’s forecast for further policy tightening. Fed members including Yellen are now describing the labor market as tight.
With many other economic indicators suggesting growth may be stalling, the onus will be even more on the labor data to sustain the Fed’s policy tightening regime.
Payrolls growth has slowed this year, averaging 121K over the last three months to May. However, this slowdown may be indicative of a tightening labor market, with less suitable skilled workers to fill jobs.
Unemployment has fallen to 4.3%, below the Fed’s downwardly revised estimate of neutral unemployment of 4.6%. Weekly unemployment claims 4-week moving average, at 245K in the 4-weeks to 16 June, is still arguably trending lower, although up from a low of 236K in the 4-weeks to 19 May. The monthly payrolls data are due next week.
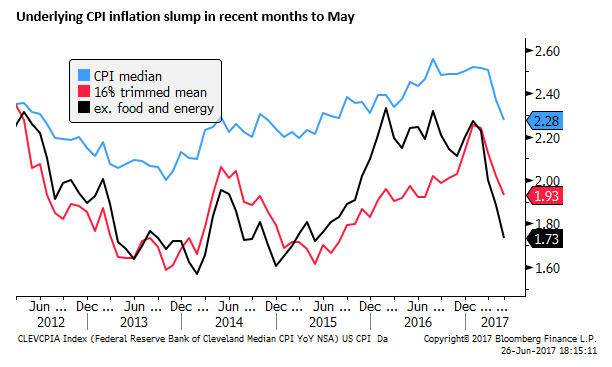
Inflation slump
It is well documented that CPI inflation has been much weaker than expected in recent months. Fed officials, including Yellen in her recent June 13 FOMC meeting, tended to dismiss this as related to special factors, such as a competitive price war on telecommunications.
San Francisco Fed President Williams on Monday reinforced these views saying “Some special transitory factors have been pulling inflation down,”….. “But with some of these factors now waning, and with the economy doing well, I expect we’ll reach our 2 percent goal some time next year.” …. “The very strong labor market actually carries with it the risk of the economy exceeding its safe speed limit and overheating, which could eventually undermine the sustainability of the expansion”
Nevertheless, various core measures that are designed to strip out the effects of individual outlier components show a significant fall in underlying inflation in recent months.
Market-based inflation expectations have also fallen in recent months. The Fed has simply said, since January, that “market-based measures of inflation compensation remain low”.
The 5yr5yr forward measure of inflation compensation from inflation-linked securities and derivatives suggests that expectations have reversed all the gains since the election of Trump.
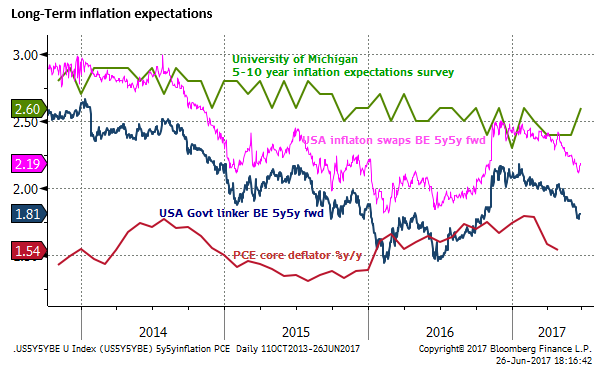
Expectations for Personal Consumption Expenditure and PCE Deflator data due on Friday are low, based on recent weak CPI and retail sales data.
Fed GDP forecasts modest in Q2
The Atlanta Fed’s GDP Now estimate for Q2 has been revised down through the quarter from an initial optimistic 4.0% plus level to 2.9% q/q saar. After only 1.2% in Q1, this would be a modest rebound.
The New York Fed GDP Nowcast is forecasting only 1.9%q/q in Q2. This would be a weak outcome, leaving growth below the average of 2.0% in the recovery since 2009; in what is regarded as an unusually slow and drawn out cyclical recovery.
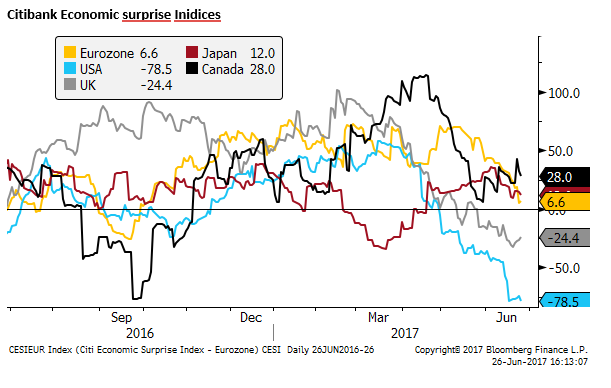
US data underwhelms
In terms of meeting expectations, US data over recent months has significantly underwhelmed. The Citibank Economic Surprise Index is at -78.5, the weakest since 2011, the lowest of any other country
Dudley-Call?
However, while the data flow is sending a warning that the economy may be stalling and inflation falling well below target, the Fed sounds at least as hawkish as it did early in the year. It appears even more honed in on the tight labor market and expressed surprising confidence in its forecast for 2.0% inflation next year.
A key reason for this, several analysts have posited, is that despite the policy easing to date, US and global financial conditions appear to have eased. Rising equity and house prices, lower bond yields and tighter credit spreads have boosted consumer wealth, and corporate access to capital.
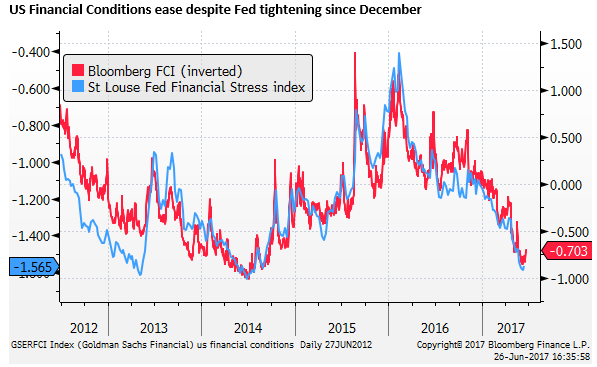
The chart below shows the Bloomberg USA Financial Conditions Index (inverted) and the St Louis Federal Reserve Financial Stress Index. Financialconditions are around the easiest since 2014, before the Fed started to warn policy normalization was coming into view. The first Fed policy tightening did not occur until December 2015. At that time financial conditions had tightened up significantly, helping explain why the Fed waited a full 12 months until December 2016 before hiking a second time.
The chart shows that despite two further hikes this year, financial conditions have eased significantly since the beginning of the year.
The FOMC June policy statements made little reference to financial conditions, but New York Fed President Dudley mad it clear that indeed the Fed has financial conditions firmly in mind in his speech at the BIS annual meeting on Monday.
Key points from Dudley’s speech were:
- “As I see it, financial conditions are a key transmission channel of monetary policy because they affect households’ and firms’ saving and investment plans and thus influence economic activity and the economic outlook.”
- “For example, during the mid-2000s, financial conditions failed to tighten even as the Federal Reserve pushed its federal funds rate target up from 1 percent to 5¼ percent. Conversely, at the height of the crisis, financial conditions tightened sharply even as the Federal Reserve aggressively pushed its federal funds rate target down toward zero. As a result, monetary policymakers need to take the evolution of financial conditions into consideration. For example, when financial conditions tighten sharply, this may mean that monetary policy may need to be tightened by less or even loosened. On the other hand, when financial conditions ease—as has been the case recently—this can provide additional impetus for the decision to continue to remove monetary policy accommodation.”
An important implication is that the Fed policy function more clearly includes financial conditions (equities, bond yields, credit spreads); this basically means that the Fed is now more influenced by the equity market.
This is not necessarily a surprise to those that have often spoken of the Fed put-option for the equity market, first popularized by the so-called Greenspan put, suggesting the Fed tends to act to prop up the equity market. However, in the current context, the Dudley speech suggests that the Fed might act to cap the equity market (‘Dudley-call’?).
In other words, the Fed may keep hiking rates, until the equity market rally stalls.
If you are an equity investor, the comments from Dudley should give you pause. If the recent economic data suggest demand is stalling and pricing power is deteriorating, the prospect of further Fed policy rate hikes poses a significant risk of equity market correction.
Structurally low inflation shifting central bank focus to real rates and financial conditions
The equity market resilience this year probably owes much to an improved global growth outlook. The fact that growth may now be driven more from outside the USA may also be helping support global equity markets, broadening and reinforcing investor confidence. The USD has been relatively weak this year, helping support emerging market asset prices.
Global bond yields remain relatively low and have declined this year (after rising late last year). Low global bond yields may have reinforced investors’ search for yield, boosting equities and higher yielding corporate and emerging market bonds. Lower bond yields have in part been encouraged by ongoing ECB and BoJ ongoing commitment to negative interest rates and QE programs.
The Fed has been tightening, but with growth and inflation in the USA underwhelming, US yields have tended to reverse increases late last year, notwithstanding the Fed’s adherence to a gradual removal of policy accommodation.
Global equity markets are starting to appear fatigued. Factors that are now weighing on equities are weaker energy prices, hurting energy shares. Curve flattening may weigh on financial shares. Retailing shares are struggling with the shift towards internet commerce. Amazon’s offer for Wholefoods has increased the market’s focus on the high-tech disruption of traditional commerce.
The increasing use of high-tech goods for business and consumer services is a source of disinflation pressure. Some policymakers have posited that the gig economy and self-employment trends, related to incorporating high-tech services into commerce, is contributing to low wage growth.
High-tech companies have been leading the rise in global equities, but perhaps this is happening at the expense of other companies’ share prices, since they are the source of disruption and weaker pricing power.
Low inflation outcomes may be encouraging central banks to keep monetary policy easy as they attempt to raise aggregate demand to achieve their inflation targets, typically at 2% or higher.
Some commentators argue that the low inflation environment is more structural and attempting to keep pushing inflation higher may result in monetary policy that is too easy, and risks building up excesses in financial markets.
If this is the case, central banks may shift from focusing less on their inflation targets, and more on targeting real interest rates and indicators of financial conditions.
This is happening to some extent in Australia, where the RBA has accepted a lower glide path back to its inflation target in deference to high house prices and excessive household debt. The Bank of Canada recently moved to a tightening bias despite weaker inflation outcomes. The Fed too may now be paying more attention to financial conditions, and less to its inflation target.
Monetary policy aimed at targeting inflation may tend to pump up asset prices to dangerous levels building in financial instability risks (by keeping real interest rates too low, below the trend rate of growth).
Weak pricing power, undermining operating margins, may dampen equity prices. But they may still rise if central banks are pursuing low real rates to attempt to boost aggregate demand and raise inflation. If central banks switch gear to managing down aggregate demand to address financial stability concerns, then asset prices might be expected to have less upside potential, including risk of a correction if they have become overbought.