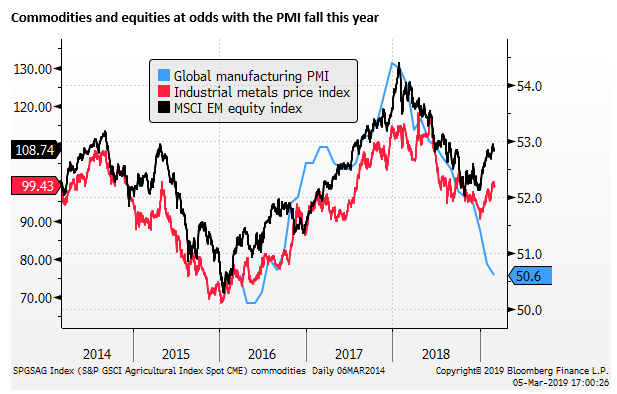
Global manufacturing PMI slump at odds with equity and commodity price rebound
The slump in the global manufacturing PMIs that is broad-based in major economies and alarming in Japan, Korea and Taiwan, appears to reflect a disruption in global trade that may relate to US tariff policy. Services PMIs, on the other hand, are relatively stable and have recovered recently, and may help the global economy avoid a recession. India’s PMIs have been relatively strong and may account for solid Indian currency and equity market performance. The slump in the global manufacturing PMI is at odds with stronger global equities and commodity prices this year. The market appears to be building confidence that the US-China trade dispute will be resolved, and the Chinese stimulus and a patient Fed will combine to revive manufacturing PMIs is coming months.
Manufacturing PMIs broadly weak
Asian manufacturing PMIs were weak in February. Two of the biggest tech producers, highly connected to the Chinese, regional and global supply chain were the weakest (Taiwan 46.3 and Korea 47.2). ASEAN countries were also weak; the ASEAN PMI fell to 49.6, a low since July 2017, the second month below 50.
However, sending mixed signals, the Chinese Caixin mfg PMI, that tends to cover more private sector firms than the national PMI, recovered from its January fall; rising to 49.9, a high since November.
India has been bucking the weaker trend in Asia; its PMI has been on a rising trend since mid-2018, rising to 54.3, a high since Dec-2019.

The Caixin Chinese mfg PMI was somewhat at odds with the national PMI released a week earlier; although broadly speaking, they were around similar levels. It is inconclusive whether the bounce in the Caixin version reflects a bottoming in mfg. The fact that the Korean, Taiwan and ASEAN PMIs were weaker in February suggests caution in interpreting the rise in the Caixin PMI as a sign of stabilisation. Furthermore, the Japanese mfg PMI fell to 48.9; the weakest of the major economies.
While the PMIs are not yet supporting a ‘risk-on’ tone in Asian markets, there were some pockets of favourable news in EM. As noted, the Indian PMI rose. Brazil’s PMI also rose to 53.4, equal to the high in March 2018.
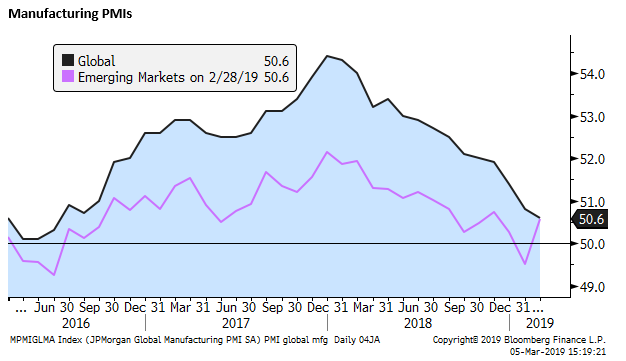
However, virtually all major economy manufacturing PMIs slipped in February, dragging down the global PMI to 50.6 in Feb, a low since 2016. With the strength in some large EMs, including the rebound in China, the EM mfg PMI rose to equal the global PMI, closing the gap for the first time in three years of data available on Bloomberg.
Services PMIs stable
In contrast to the manufacturing PMIs that were more negative than positive, with some key exceptions in India, Brazil and China Caixin, services PMIs tended to be stronger in most countries.
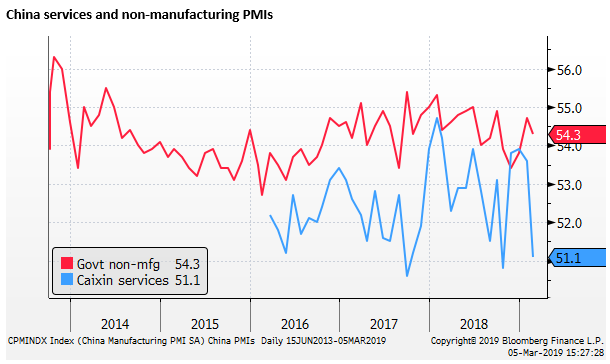
China was an exception with a sharp fall in the Caixin services PMI to 51.1. However, this came after several solid results above 53.5, so it cannot be interpreted as a downshift in the trend. The national non-mfg PMI remained in a stable range at 54.3 in Feb.
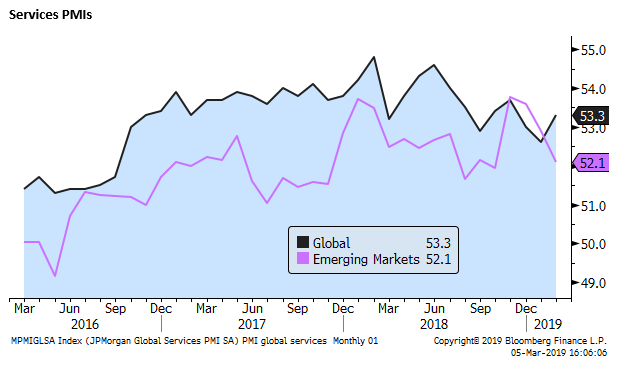
The global services PMI rose in Feb to 53.3. After recently rising above the global services PMI in Nov-Jan, the EM services PMI fell back below in Feb (52.1); reflecting the sharp retreat in China Caixin.
India’s services PMI has been relatively stable around its highs since mid-2018; at 53.7 in February. Combining with the uptrend in its manufacturing PMI, overall India is showing relative strength.
Services PMI rose in all major economies, contrasting with the weaker manufacturing PMIs. This is an encouraging sign that the slump in manufacturing PMIs that appears to reflect disruption in global trade that may relate to US tariff policy may not drag down the global economy into recession.
A closer look at China PMIs
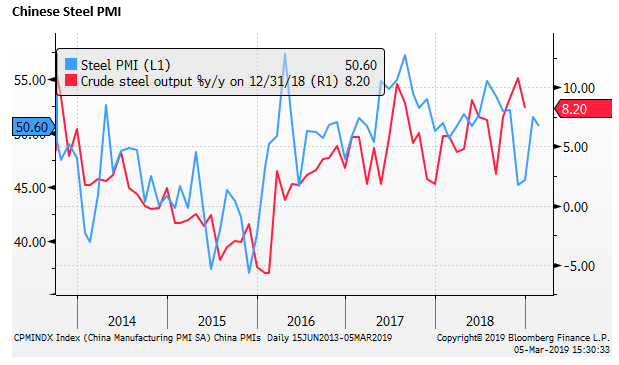
In terms of the materials sector in China, the steel sector PMI has rebounded above 50 for the last two months. This may reflect government support for infrastructure spending and may tend to support Chinese demand for Australian steel-making commodities.
Components of the China national mfg PMI suggest that disruption in the global supply chain was a key point of weakness. The import (44.8) and export orders (45.2) components were the key drags on the overall PMI. This may explain the weakness in Korean, Japan, Taiwan, and ASEAN PMIs. It further gels with the broad weakness in major economy manufacturing PMIs. Global trade indicators in PMIs appear to have fallen rapidly through the second half of last year and further into the first two months of this year. This may reflect in part the fallout from US tariff policy.
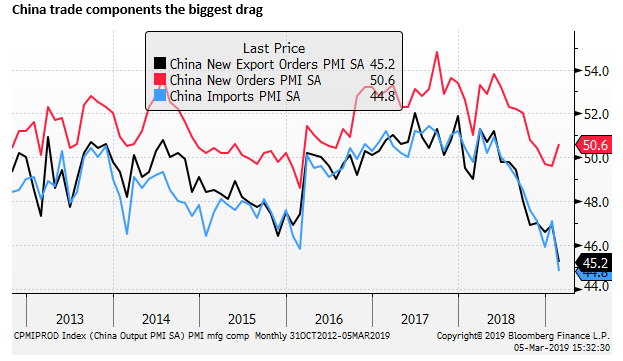
However, the overall China new orders component rose in for the first time since May last year. This may reflect the impact of Chinese stimulus measures, helping offset the drag from the external sector.
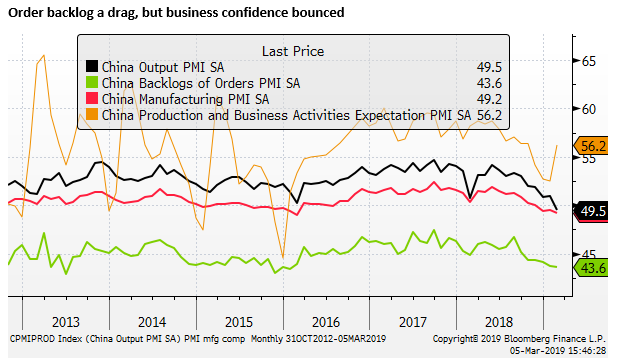
The recovery in new orders, if it continues, may lead a recovery in the national mfg, although the backlog of orders was still down around its low since 2016.
It is quite volatile, but worth noting that the business expectations component was also up in February.
In the break-down by company size, the national China PMI showed weakness was most intense in small (45.3) and medium-sized (46.9) companies; whereas large companies recovered for a second month (51.5). This is consistent with reports that smaller companies have been more affected by credit tightening. However, it doesn’t appear to gel with the Caixin PMI that rose in Feb and is supposed to reflect more the developments in the small and medium-sized firms.
Looking ahead, it is encouraging that Chinese policy stimulus has been targeted to address the credit tightening at smaller private firms.

Asian currencies
Looking through the lens of the PMI data we can evaluate some of the trends in Asian markets.
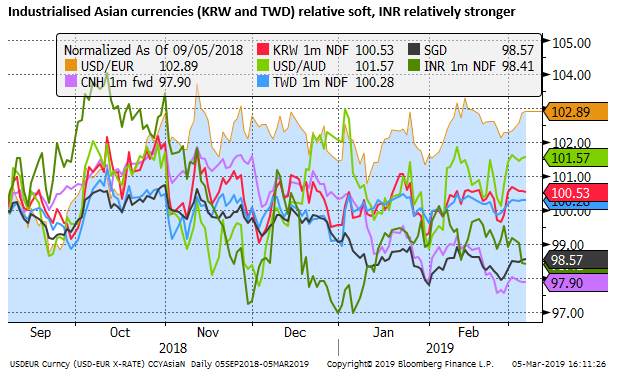
Over the last six months, the CNY is the strongest currency among the highly industrialised Asian currencies which probably reflects trade talks with the US and Chinese efforts to assuage US concerns that it might weaken its currency to regain lost trade advantage due to tariffs.
Chinese policymakers have probably preferred a relatively stable currency to help reduce the risk that its weak stock market last year might fuel capital outflow and further tighten domestic credit conditions.
The rebound in Chinese equities this year, reflecting broad policy stimulus measures, including efforts to ease credit tightening and fiscal measures, may have helped boost the CNY. Reports that the US and China are close to a trade deal, which includes an agreement of exchange rate policy, has probably further supported the CNY in the last month.
The next strongest currencies after the CNY are the SGD and INR. As discussed above, India’s PMIs have bucked the weakening trend in the region, and this may help account for relative strength in the INR.
The KRW and TWD have been relatively stable, towards the softer end of their range over recent months, lagging behind gains in other region’s EM currencies. This is consistent with weaker trends in Korean and Taiwan PMIs.
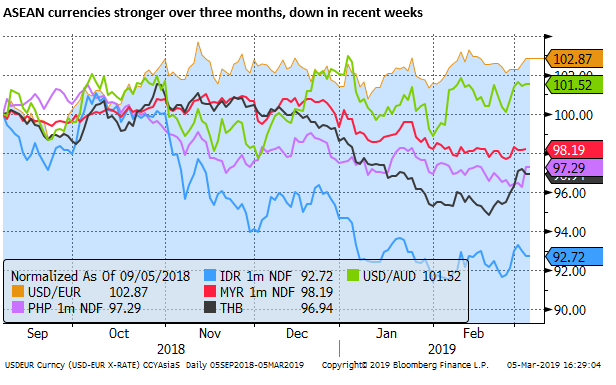
ASEAN currencies are stronger over three months, although they have lost ground in recent weeks. The weaker ASEAN PMI may be damaging sentiment for these currencies.
Asian equities
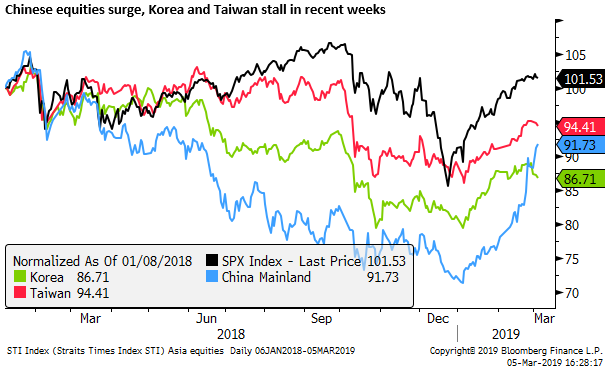
Since the beginning of the year, Chinese equities have been rising sharply. They have reversed much of their underperformance of other regional equities over the last year. Surging Chinese equities seems at odds with the weaker manufacturing PMIs. It reflects a number of specific measures designed to shore up the equity market; including measures to ease credit tightening for private sector companies.
The rebound in Chinese equities may also reflect increasing optimism of an easing in trade tensions with the US. If so, the Chinese equity market may be predicting a recovery in Chinese and regional PMIs in the coming months.
However, the further surge in Chinese equities in the last two weeks has not been matched by other Asian equities. Korean and Taiwan equities have ebbed in recent weeks, which is more consistent with soft PMI readings.
ASEAN equity markets have also lost momentum in recent weeks, which may reflect weaker ASEAN PMIs.

We have to be cautious to take away too much positive news from the rebound in Chinese equities. It has not been corroborated by broader strength in regional equities. Other Asian equities in the region are generally stronger this year, in-line with a rebound in US and global equities. But they have stalled recently, and remain in a downtrend over the last year.
It is possible that capital moving into Chinese shares may be detracting from capital flows into other Asian equities in recent months; as such, we can still take some positives from the rapid recovery in Chinese equities.
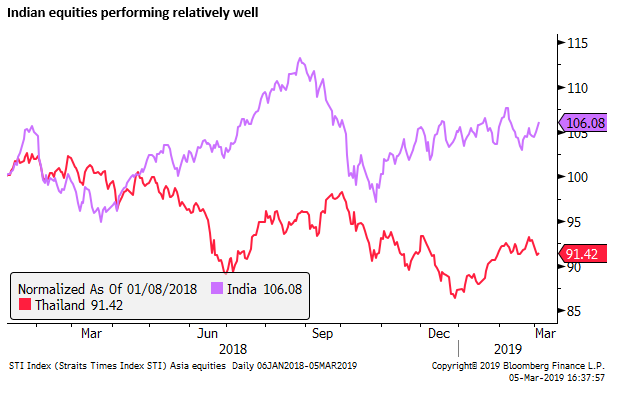
India’s equity market has been one of the better performers, consistent with the PMI data suggesting that the Indian economy has been able to buck the weaker PMI trend in the region, less affected by the disruption in global trade.
Commodity prices
Consistent with the recovery in global equities and other markers of risk appetite this year, commodity prices have also risen including both oil and industrial metals prices
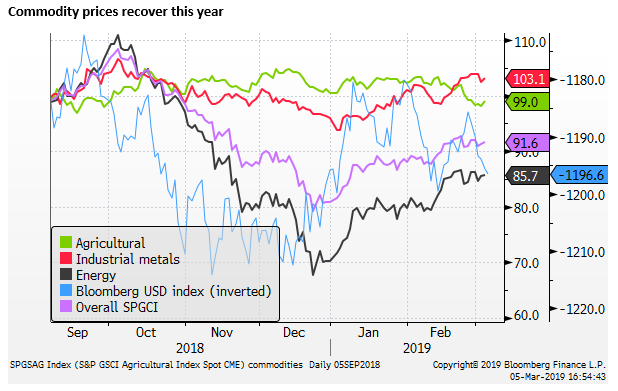
The recovery in industrial metals prices so far this year is at odds with the further fall in the global manufacturing PMI.
The question is – does the slump in the PMI portend a reversal of stronger global equities and commodity prices? Or does the rise in equities and commodities this year reflect optimism that the US-China trade dispute will be resolved, and Chinese policy stimulus and a patient Fed generate a recovery in the global PMI?