Metals and energy in the dog house
Softer UK and US data take some support away from their currencies. The market does not appear to be preparing for any surprise easing by the BoJ on Friday, with little chance of a rate cut priced in. Energy and metals commodity prices and equites are languishing and the idea that China is rotating towards services and IT consumption while its industrial sector is still declining is taking hold.
It feels so 1990s again
Commodity indicators are weak, and have failed to benefit from the policy easing delivered by China and effectively delivered by the ECB’s strong hints of more action in December. The energy sector looks particularly weak with oil, gas and coal prices all falling; the first two to long term lows and oil threatening to break previous lows in September. Metals prices are not faring much better. Energy, metals and steel sector equites all fell around 3% on Monday, reversing gains last week and down to around their lows for several weeks, in stark contrast to the booming strength recently in IT software and services shares that have shot up to new highs.
This is consistent with the rotation in the Chinese economy that is getting much more notice. Chinese policy makers are supporting growth and its service sector is recovering, but the down-turn in heavy industry has continued.
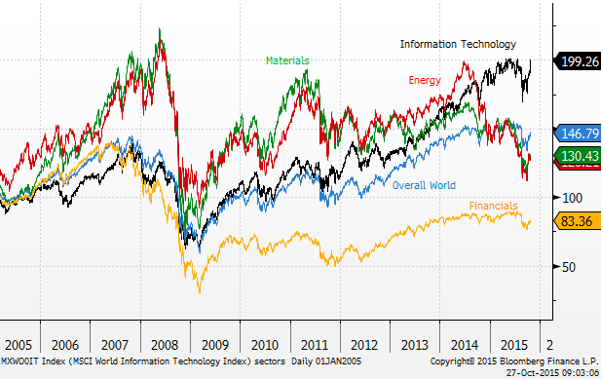
Some may say it looks so very 1990s again. In the late 90s global investors were enamoured in IT, especially Dotcom start-ups at the time, and commodity producers were considered “old-world”. Certainly the tables have been turned from the late 2000s when Commodity producer equites were the high-flyers. The chart below compares MSCI global sector stock indices since 2005.
This does not bode well for AUD or CAD, and both should be considered in the dog-house. Australian rates policy is coming into view, and the CPI data due tomorrow may influence expectations. Many prominent economists have backed away from expecting a cut by the RBA in November, seeing evidence that the non-mining sector is improving, and too soon to tell if the prudential measures that have resulted in higher variable mortgage rates in the last two weeks are sufficient to take the steam out of the housing market. However, Sydney auction clearance rates continued to fall to a low since 2012, so the tide does appear to have turned, and this may encourage the RBA to move to a more dovish stance next week.
MSCI Global Sector stock indices
In the news
- Soggy data cloud picture for divided Federal Reserve – FT.com
- Sydney reported its lowest housing auction clearance rate of the year last weekend, at a lows since spring of 2012. It fell from 65.1% to 64.4%, below 78.9% in the same week a year ago and near 90% in May. This follows the announcements by the major banks in the last two weeks that they were raising their variable mortgage rates to accommodate the higher cost of capital driven by prudential measures to raise their capital adequacy measures.( Sydney auction market plummets as rates rise – smh.com.au)
What They Said
- Chinese central bank advisor Huang Yiping said GDP growth may be 6.9%in Q4 and slow to 6.6% in 2016. Current deflation pressure is large and worth paying attention to. It is necessary to let some bonds default as long as the whole market won’t collapse. The central bank has room for more monetary policy easing this year. The country’s fiscal position has room to ease as government debt-to-GDP is less than 50% (According to a Bloomberg story).
- Marc Faber of the Doom Gloom and Boom report said he sees current growth in China more like 3 to 4%, saying “Growth figures that the government are publishing do not match the reality.” He said, “I have no doubt that some service sectors are growing but industrial production isn’t.” He said investors should be mindful of a credit bubble. Noting “very heavy capital flight”, he said, “I would bet on the locals who are shifting money out of China at a record level at the present time.” (Bloomberg TV interview).
- IMF Asia Economist Changyong Rhee: “They [China] definitely have a manufacturing slowdown, an overcapacity problem. But other parts of China are actually growing faster.” Services now account for more than 50% of the country’s economy and there is a good chance their contributions are being underestimated, he said.
Although the value of imports has fallen, volumes tell a different story. By adjusting for the fall in commodity prices and the appreciation in the yuan, the IMF calculates imports actually grew in July by 2%. And while the amount of goods imported has declined, imports of services are in double digits.
The IMF estimates overinvestment totals nearly 25% of the country’s growth domestic product.
“The spillovers that we are now seeing are much larger than we anticipated…about double what we thought it was” Mr. Rhee said. That means that for every one percentage-point cut in China’s growth, it saps around 0.8 percentage point of growth from many Asian economies, he said. (China Pessimism Is Overblown, IMF says, Citing Booming Services Sector – WSJ.com)
- Japanese Finance Minister Taro Aso: 17-Oct: “At this point, the government is not thinking anything like that [does not support further monetary policy easing?], and probably the Bank of Japan will not undertake additional monetary easing right now.”
23 Oct: “It is difficult to achieve the BoJ-set 2% inflation goal only through monetary easing” (Many are interpreting as government pressure not to ease monetary policy).
Economic news
- US new home sales fell 11.5%m/m in Sep, much below -0.6% expected, and the previous two months were also revised lower. These data are out of step with existing home sales and the NAHB housing market index. New mortgage rules were implemented on 3-Oct, and these may be causing some disruption to the market around their implementation. (New Mortgage Rules May Spark Delays, Frustration – WSJ.com)
- Dallas Fed Manufacturing index fell from, -9.5 to -12.7 in Oct, weaker than -6.5 expected. The index is up from the low for the year of -21 in May, but retracing from a recovery to -5 in July, continuing to be weighed down by the weak energy sector. The data is weaker than the improvement recorded in the Kansas City index and Markit national flash reading reported on Friday.
- Germany’s IFO business climate index fell slightly from 108.5 to 108.2, firmer than 107.8 expected. Currently conditions fell from 114.0 to 112.6, weaker than 113.5 expected. The outlook rose from 103.3 to 103.8, above 102.4 expected. The dip in current conditions probably reflects the VW scandal. Overall the data is consistent with a moderate recovery in Germany, losing a bit of momentum in recent months.
- French jobseekers (unemployed) fell 23.8K in Sep, stronger than a rise of 3.2K expected. The data can be volatile, but it is the lowest reading since Aug-2013, and the lowest three-month average in the same period.
- UK BBA loans for house purchase fell, a sign the housing market may be cooling. They were down from 46.57K to 44.49K in Sep, reversing more than the previous two months rise from a high since Feb-2014.
- UK CBI Industrial trends survey total orders index fell the most in two years from -7 in September to -18 in October, weaker than -9 expected, a low since June 2013. Export orders fell from -24 to -28. Finished stock rose from +7 to +9. Business optimism fell from +8 to -12 in the three months from July to October, equaling the low in Oct-2012, the low since Jan-2012.
- Australian weekly consumer confidence was largely stable, up a touch from 113.3 to 113.4 last week. Firmer from Q3, but somewhat below long run average levels.
- Korean consumer confidence rose from 103 to 105 in October, rising from a low of 99.0 in June, to equal the high in May since October last year, at its average since 2010.
- New Zealand trade balance was a deficit of $NZ454m seasonally adjusted in Sep, wider than -336m in Aug. The trend is wider at -376m, the widest in at least three years available on the government website. The 12month ended deficit is around a wide since 2009. Exports fell 8.6%m/m and imports fell 5.5%m/m in seasonally adjusted terms. Exports rose 2.0% from a year earlier and imports rose 9.2% from a year earlier in non-seasonally adjusted terms. In the quarter, exports showed an improving trend after a lull in the previous year; they rose 6.4%q/q in Q3 in seasonally adjusted terms, after a 0.4%q/q rise in Q2, led by stronger rural exports sold to China. Higher milk prices since the low in August helped raise export values. Exports to China rose 8.6%q/q in Q3. Imports also rose strongly in the quarter, up 9.2%q/q. Capital goods imports were up 23%q/q, boosted by lumpy aircraft imports, but other types were also strong, consumption imports rose 10%q/q. Imports from China rose 10%q/q.
- Thailand exports improved somewhat from -6.7%y/y in Aug to -5.5%y/y in Sep, stronger than -8.1% expected. Imports fell 26.2%y/y, falling more than -20.5%y/y expected, the deepest fall since 2009, taking the trade balance to $2.29bn, the largest surplus since 2010.
- Singapore industrial production fell 4.8%y/y in Sep, close to expected, up from -7.1%y/y in Aug. Biomedical exports jumped 26.3%y/y, electronic exports fell 8.6%y/y.
Markets on the Move
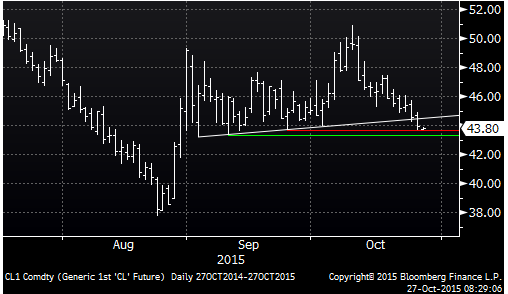
- Oil prices fell around $0.80, continuing the steady fall from the recent high on 9-Oct, now trading right on the lows in the second half of September, and potentially already below a slight rising trend line support since early-Sep, suggesting downside risk has increased.
- Thermal coal futures prices in China fell sharply on Friday and Monday, down 4.5%, to new lows since the contract started in January this year.

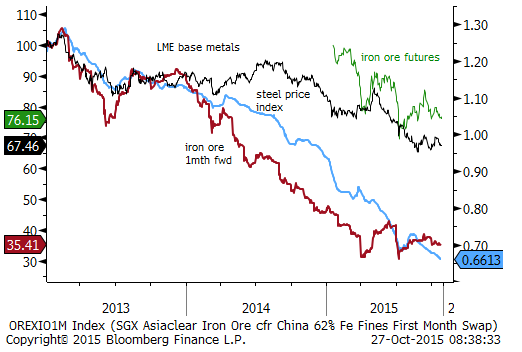
- Metals markets also continue to display a weaker trend (see chart below)
- US stocks were down 0.2%, the energy sector was down 2.5%, back to a low since 6 October. Metals and mining sector fell 2.9% and the steel sector fell 3.4%. However, software and IT services rose 1.1% to a record high, building on the 3.9% surge on Friday.
- US 2 year swap rates fell 1.8bp on Monday, reversing half of their rise on Friday to a high since 9-Oct. US housing and manufacturing data were soft
- Eurozone 2 year swap rates fell a further 1.4bp to another record low of a negative -0.031%.
- UK 2yr swap rates are down about 1bp, a pretty limited fall considering the degree of weakness in the CBI and BBA industry and housing data (see above).
- Australian rates stable over the last week, New Zealand rates firming a little to a high in a round one month.
- Japan rates stable, and swap rates remain just above 10bp, suggesting little expectation of further BoJ policy easing, and no expectation that they may cut its target cash rate from 10bp.
On the Radar
- China Industrial profits
- Japan PPI services
- Taiwan Monitor Indicator
- Philippines Trade balance
- UK GDP Q3, index of services
- Eurozone Money supply and credit growth
- Germany Retail sales
- Canada BoC Deputy Governor Timothy Lane speech
- USA Durable goods orders, CB Consumer confidence, S&P/CS house price index, Markit PMI services, Richmond Fed mfg index.
- China 26/29 Oct – 5th Plenary Session of the 18th Central Committee of the Communist Party of China. The 13th Five year plan (2016-20) will be top of the economic agenda (some focus on if the growth target is revised down).
Later this week
- Australia 28 Oct – CPI
- Australia 29 Oct – New home sales
- Australia 30 Oct – Credit growth
- Japan 28 Oct – Retail sales
- Japan 29 Oct – IP
- Japan 30 Oct – Employment, Household spending, CPI
- Japan 30 Oct – BoJ policy and semiannual outlook/Kuroda press conference
- China 28 Oct – Consumer confidence
- China 28/31 Oct – Leading Index
- China 1 Nov – Government sponsored PMI mfg and non-mfg
- USA 28 Oct – trade balance advanced
- USA 28 Oct – FOMC
- USA 29 Oct – GDP Q3
- USA 30 Oct – Employment Cost Index
- USA 30 Oct – Personal income/expenditure, PCE inflation data
- USA 30 Oct – ISM Milwaukee, Chicago PMI, UoM Consumer sentiment final
- New Zealand 29 Oct – RBNZ Official Cash rate (OCR) review
- New Zealand 30 Oct – Building Permits, ANZ business survey, Credit growth
- Canada 29/30 Oct – CFIB Business barometer
- Canada 30 Oct – monthly GDP
- Eurozone 28 Oct – ECB’s Coeure, Praet and Constancio speak
- Eurozone 29 Oct – EC surveys on business, services and consumers
- Germany 29 Oct – CPI and unemployment
- Eurozone 30 Oct – CPI first estimate for October
- Eurozone 30 Oct – Unemployment
- UK 29 Oct – Nationwide house price index, money supply & credit growth, CPI retail sales monitor
- UK 30 Oct – Consumer confidence, Lloyds’ business barometer
- Singapore 30 Oct – Money supply
- Thailand 30 Oct – Current Account
- Thailand 30 Oct – Manufacturing production and capacity utilization
- South Korea 28 Oct – retail sales
- South Korea 30 Oct – business surveys and leading index
- South Korea 1 Nov – Trade balance
- Philippines 30 Oct – Money supply
- Taiwan 30 Oct – GDP Q3
- Taiwan 1 Nov – PMI Mfg
- India 30 Oct – Fiscal deficit
- Malaysia 30 Oct – Money Supply
Further out
- Australia 3 Nov – RBA rates policy
- Australia 5 Nov – RBA Governor Stevens speaks
- Australia 6 Nov – RBA Statement on Monetary Policy
- Australia 2 Dec – GDP Q3
- Japan 6 Nov – Labor cash earnings
- Japan 16 Nov – GDP Q3
- Japan 19 Nov – BoJ
- Japan 27 Nov – CPI
- Japan 14 Dec – Tankan
- Japan 18 Dec – BoJ
- China 2 Nov – Caixin Mfg PMI
- China 4 Nov – Caixin Services PMI
- China 8 Nov – Trade balance
- China 10/11 Nov – CPI, Credit, Retail sales, IP, Fixed Asset Investment
- USA 2 Nov – Market PMI mfg final, ISM manufacturing, construction spending
- USA 4 Oct – ADP employment, ISM non-mfg
- USA 5 Nov – Fed Vice Chair Fischer speaks at the National Economists Club
- USA 6 Nov – Payrolls
- USA 3/19 Nov – Congressional Debt ceiling approach. (WSJ article)
- USA 25 Nov – PCE deflator inflation indicator
- USA 3 Dec – Fed’s Yellen speaks to the Economic Club of Washington
- USA 4 Dec – payrolls
- USA 16 Dec – FOMC
- New Zealand 2 Nov – Treasury monthly economic indicators report
- New Zealand 4 Nov – Labour report Q3
- New Zealand 17 Dec – GDP Q3
- Canada 4 Nov – Trade balance
- Canada 6 Nov – Labor data
- Germany 5 Nov – Factory orders
- Eurozone 13 Nov – GDP Q3
- Eurozone 2 Dec – CPI first estimate and unemployment
- Eurozone 3 Dec – ECB meeting
- UK 3 Nov – PMI mfg, PMI construction
- UK 4 Nov – PMI services
- UK 5 Nov – BoE inflation Report and policy decision
- UK 11 Nov – employment data
- UK 7 Nov – CPI
- UK 10 Dec – BoE policy decision
- South Korea 2 Nov – Current Account, PMI Mfg
- Taiwan 2 Nov – PMI
- Indonesia 2 Nov – PMI and CPI