What next for US inflation?
In the next week or so, key US inflation data are released; wages data on Friday (6 Apr), PPI on the following Tuesday (10 Apr), and CPI on the following Wednesday (11 Apr). FOMC minutes are also released on 11 April. These data have sent mixed messages so far this year and contributed to the rise in bond yields and equity market upheaval in February. Temporary factors start to wash out of the CPI data, PPI is rising faster on a weaker USD and firmer commodity prices. Tariff fears boosted the ISM prices data. A tightening labor market may show up in wages, and the FOMC was more hawkish than widely perceived by a distracted market.
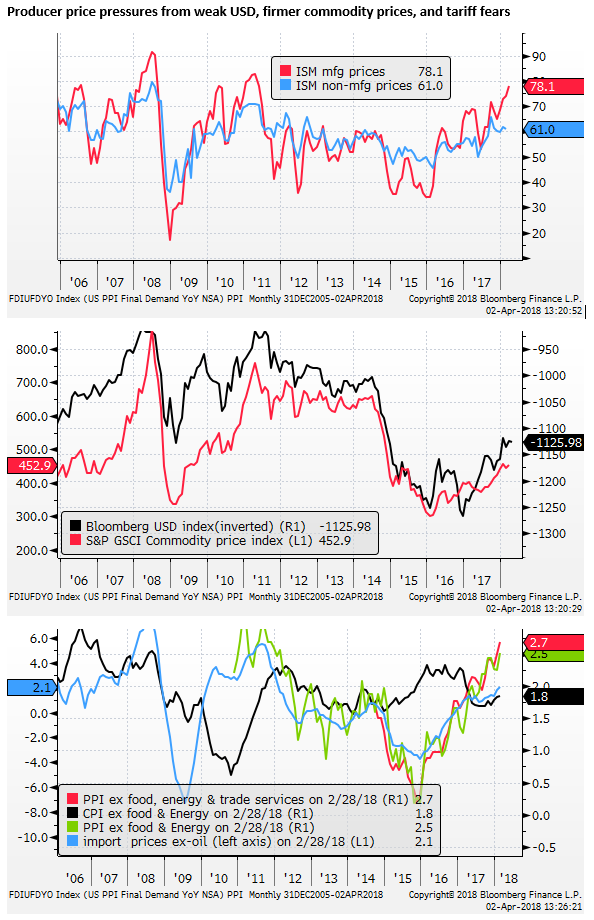
Producer price pressures
The wages and CPI data were benign in February, relieving pressure on the market after both were above expected in January.
However, the February core PPI data rose to a peak in several years, showing the effects of a weaker USD and firming commodity prices. While largely ignored, they point to upside risks for CPI inflation in coming months.
The ISM manufacturing prices paid indicator further points to upward price pressures.
The rise in ISM manufacturing prices from 74.2 to 78.1 in March appears in part to relate to a scramble to get ahead of tariffs on steel and aluminum. Price increases and shortages in inventories for steel and aluminum were reported by the ISM.
Higher factory input prices are showing up in rising import price and PPI inflation data, and this may soon place upward pressure on the CPI.
Market distractions
The financial market’s attention to recent US economic reports has been limited in recent weeks with burgeoning concerns over privacy and other issues hitting the big US tech stocks. Trade protectionist fears have also undermined global equities. More generalized risk aversion is developing, and this threatens to undermine global economic confidence. This is tending to push down global bond yields.
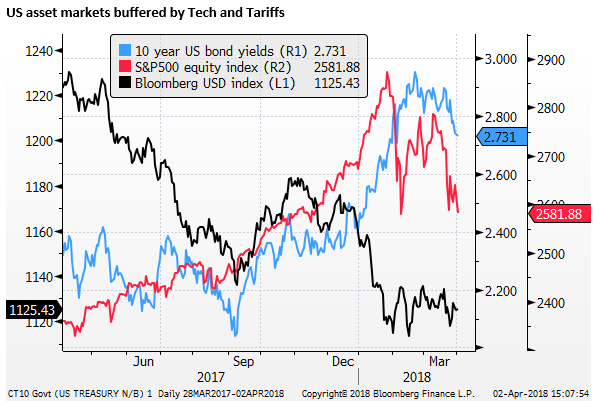
The impact on currency markets is less obvious, the USD has become mixed but on average is still largely range-bound in recent months. The EUR/USD exchange rate has been trading in a sideways choppy range since late-Jan. USD/JPY is modestly lower but has also been largely trendless in recent months. AUD/USD has been one of the weaker currencies, but its fall to-date is still far from aggressive. Overall, currencies are lacking clear direction.
Relatively benign US inflation indicators might leave the market watching tech stocks and tariff developments. However, higher than expected inflation data may add to equity market uncertainty by raising the prospect of Fed tightening faster than it might otherwise.
FOMC forecasts were more hawkish
The FOMC minutes are released on 11 April next week. The FOMC market projections moved towards a more hawkish position on their economic and rates outlook. However, the market was quickly distracting by tariff announcements after the release of the FOMC decisions on 21 March and paid these hawkish elements little attention.
FOMC Quick Take -upgrade to forecasts, but sets a suck it and see tone; 22-Mar – AmpGFXcapital.com
The risk is that the minutes give these hawkish elements a second chance to influence the market, particularly if matched by a higher CPI releases earlier on the same day.
A traditional reaction to higher inflation and a more hawkish tone of FOMC minutes should be higher US bond yields and a stronger USD. And we see this as a significant risk. However, with the potential for a fallout to jittery asset markets, it is harder to be sure how the FX and bond markets will react. We may start to see weaker EM currencies and a stronger JPY if fears of faster Fed rate hikes plays poorly for global equity markets.
Temporary factors washing out of inflation
Last year there was a weak patch for inflation data between March and July, described by the Fed as caused by temporary factors. This depressed the headline inflation readings. In the data due next week for March 2018, the market is expecting a rise in both core and headline CPI annual inflation as these temporary weak data last year begin to fall out of the year-ended change.
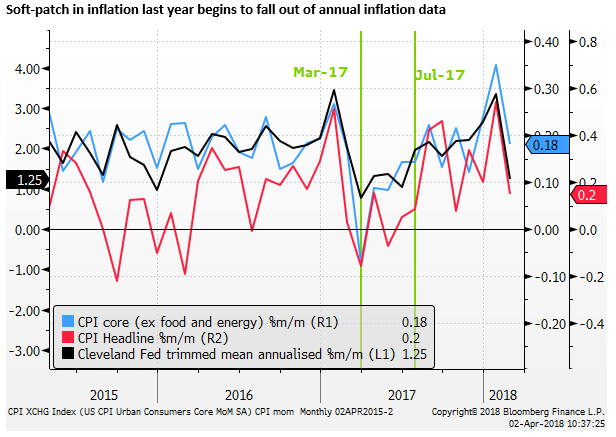
The chart above shows that both underlying and core CPI had their highest monthly increase in several years in January. For the headline, it was a high in five years, for core excluding food and energy it was 12 years. For the Cleveland Fed trimmed mean underlying measure, it was the largest monthly rise since January a year earlier.
The CPI headline and core (ex-food and energy) were as expected in February, but the monthly gains were also much weaker than January, back in a familiar zone. The monthly change in the trimmed mean was particularly weak, down sharply from an annualized monthly gain of 3.36% in Jan to 1.25% in Feb; a low since June last year. The lower inflation outcome in February may have helped cap bond yields in March.
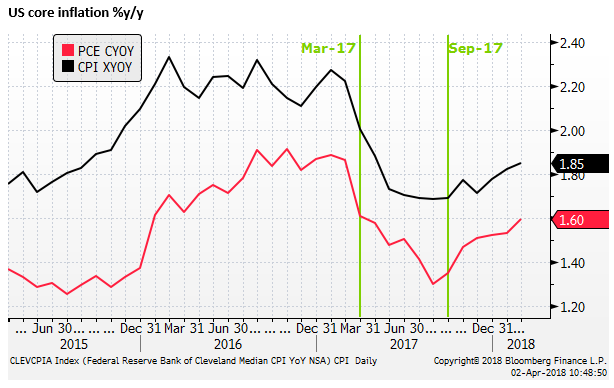
Core annual inflation data looked very weak from March to September last year, and has been creeping higher since. The median market expectation on Bloomberg is for a rise in core inflation from 1.8% to 2.0%y/y in March.
Labor cost data mixed
Like CPI inflation, the January wages data released in early-Feb were higher than expected and helped push longer-term US bond yields to their highs for the year in Feb, and trigger a significant bout of equity market upheaval that has continued since for other reasons. However, wages were weaker than expected in February (released in early-March), pushing them back into a more familiar zone.
The quarterly Employment Cost Index annual increase rose to a high in Q4 (2.6%y/y) since Q1-2015, equaling the high since the Global Financial crisis in 2008. The wages and salaries component rose more emphatically to its high since data available in 2005 (3.1%y/y).
The average hourly earnings data, released monthly with the payrolls report, have been in a stable trend for around 18 months; albeit around their highest rate since 2008. They rebounded from a weak October last year (2.3%y/y) to 2.8%y/y in Jan; equal to the previous highs in recent years. In the most recent report for February, the January reading was revised down from an initial reading of 2.9%, and they fell back to near the middle of its range in recent years of 2.6%y/y in Feb.
Any sign that this highly watched measure is accelerating (March data released on Friday) is likely to boost inflation expectations significantly, especially in the context of falling unemployment and other measures of a tightening labor market.
In his recent comments (1 Mar Congressional Testimony and 21-March FOMC press conference), Fed Chair Powell said that there is no “decisive” sign that wage inflation is accelerating. As such, a clearer rise in earnings would be viewed as a surprise to the Fed
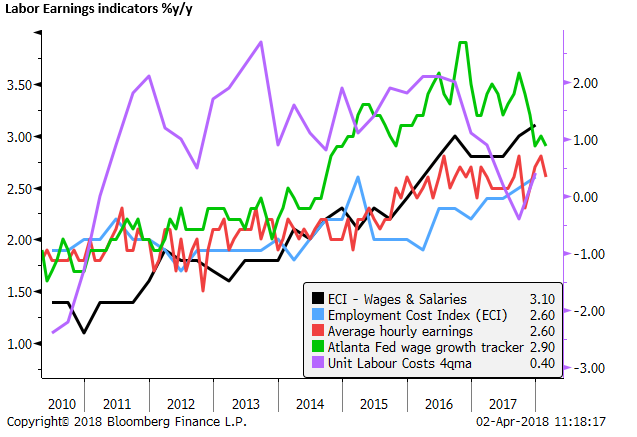
The Atlanta Fed’s wage tracker has been noticeably weaker in recent months, falling from 3.6%y/y in Sep last year to between 2.9% and 3.0%y/y in Dec to Feb; suggesting wages growth has decelerated. However, this measure had risen at a notably faster rate than either the average hourly earnings or ECI since 2014. Nevertheless, the lower recent momentum in this data is perhaps a sign that wage inflation is facing headwinds despite a tightening labor market.
There is one element of the Atlanta wages tracker that points to higher wages. Its component for “Job switchers” rose in the last two months to 4.0%y/y, a high since Sep last year. This volatile series stands out from the other components in the Atlanta wages data. One might presume that job switchers will benefit more from a tightening labor market and might tend to lead wage trends.
Wage Growth Tracker – FRBAtlanta.org
Even though wage growth since the Global Financial Crisis has been modest, unit labor costs were still rising typically between 1 and 2% from 2011 to 2016, helping underpin inflation, because labor productivity growth has been relatively weak; averaging only around 0.5%y/y in recent years. However, unit labor cost inflation fell in 2017 to around of 0.4%y/y, suggesting less generalized inflation pressure. However, this measure is highly volatile.
Tightening labor market
While there may be structural impediments to wage growth, the tightening labor market suggests that it should start to rise at some point.
Unemployment claims are at their low since 1971, considering the growth in population over that time this is remarkably low, well below the previous cyclical troughs over the last 30 years.
The number of job openings in February was at a record as a percentage of the number of unemployed since openings data started in 2001. The data show that there is near to one job opening for every unemployed person.
The unemployment rate has been stable at 4.1% since Oct, and the U-6 underemployment rate that includes people working part-time for economic reasons and those marginally attached to the labor force has actually ticked up from 8.0% in October last year to 8.2% in Feb. However, a number of indicators suggest that these measures may fall further soon.
The FOMC median forecast predicts that the unemployment rate will fall to 3.8% this year, and to 3.6% in the next two years, well below its median estimate of neutral unemployment of 4.5%; an estimate they have consistently lowered as actual unemployment has undershot expectations without (yet) notably pushing up wages.
The Fed and the market should be vigilant for signs of wages accelerating.