Oil the risk-spoiler
Since the beginning of the year there has been an unusually high correlation between oil and the US equity market, and to some extent the Chinese currency. All three have been in a down-trend this year. Oil and equities would not normally have a high correlation, but the very low level of oil and the sharp further fall in over the last month has raised more fears of corporate defaults in the energy sector and troubles in energy-producing emerging countries. Corporate and emerging market risk premia have risen to new multi-year highs. While the US market rebounded on Thursday, a key point that may contain a bounce back in risk appetite is fear that the debt problems in the energy sector and emerging markets will only bubble to the surface as debts fall due for re-financing over the year ahead. Nevertheless, comments from the Fed’s Bullard on Thursday illustrate that the Fed could change tack and put hikes on ice for longer. The ECB may also ease again, and Chinese policy-makers may continue to place more emphasis on stabilizing its markets. At this stage it appears appropriate to keep risk light, given policy uncertainty and uncertainty over the state of the Chinese markets and economy.
Oil the risk-spoiler
Since the beginning of the year there has been an unusually high correlation between oil and the US equity market. Also featuring in market commentary on equities is the influence of the Chinese currency market.
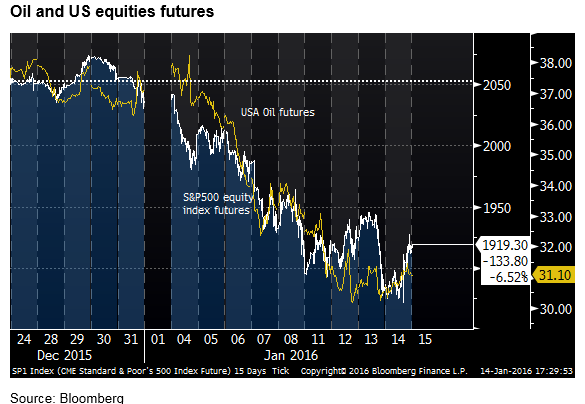
Oil and equities would not normally have a high correlation, but the very low level of oil and the sharp further fall in over the last month has raised more fears of corporate defaults in the energy sector and troubles in energy-producing emerging countries. The benefits to global consumers of lower oil prices remain a supportive factor for global growth, but confidence and spending has not strengthened as much as hoped or predicted a year ago.

While both oil and equities rebounded Thursday, the real issue is that the sustained low level of oil prices around $30 or $40 will keep financial pressure on energy sector assets that will find it difficult to refinance their debts over the period ahead.
Since the broad consensus is that there is a severe oil supply glut and global demand is likely to remain in a weak growth path at best, we might expect the potential rebound in oil and global risk appetite to be tepid.
Lower inflation expectations may influence the Fed
The recovery in US equites today was aided by a dovish assessment from Fed member Bullard, highlighting the recent fall in market-based measures of inflation expectations. Bullard is often cited as a bellwether of Fed direction, although he tends to flip-flop a bit and can be mis-leading.
The Fed position is that oil price falls should be mostly treated as temporary influences. But Bullard suggested the fall in oil prices might now appear a more prolonged affair that has or will weaken longer term inflation expectations. He suggested the recent falls in market-based measures of inflation compensation may be evidence of this.
He said, “With renewed declines in crude oil prices in recent weeks, the associated decline in market-based inflation expectations measures is becoming worrisome”
“Headline inflation will return to target once oil prices stabilize, but recent further declines in global oil prices are calling into question when such a stabilization may occur.”
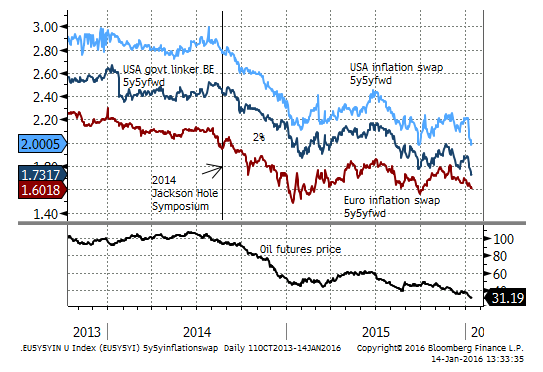
The chart below looks at the 5year-5year forward implied inflation expectations from inflation linked securities in the US and Europe. It does appear that the fall in oil prices over the last 18 months has weighed on long-term inflation expectations both in Europe and the US.
US inflation compensation has dropped significantly just in the last two weeks to new lows using TIPS and to revisit the previous low set in Sep using inflation swaps. The data may be a factor that delays further Fed rate hikes
Another data point that may build the case for holding rates in the US steady for longer is that US weekly jobless claims have weakened (risen) modestly over the last two weeks to a high since July. Overall, the job market appears healthy, but combined with recent ebbing in several Q4 activity indicators it would not surprise if employment lost momentum in Jan/Feb.
We need to be wary of commentary from Fed members further up the food chain turning the temperature down on potential rate hikes in 2015. This could help stabilize US equites and provide some further reprieve for global risk appetite.
It could lift commodity and EM currencies from recent lows. However, it would have mixed implications for JPY and EUR that have benefited recently as safe havens.
Of course, as we have seen this year, there is considerable scope for developments in China and the oil market to generate their own influence on global risk appetite, independent of market views on Fed policy direction
Furthermore, we argued in AmpGFX reports earlier in the year that the Fed would not be as easily swayed from policy hikes this year, including accepting a greater degree of weakness in US asset markets before revising back on their own rate hike projections.
Indeed we have seen a significant rise in risk premia and weakness in equites, and still the market, in general, anticipates the Fed will hike around twice more this year. This is a key reason why asset markets have been so reactive to oil prices and events in China.
We still broadly view this to be the case, but the market may have moved to a point where it does begin to contemplate a more responsive Fed that puts its rate hikes on ice for longer and provides scope for at least some reversal of recent equity market weakness.
Overall, it is time to be cautious with trades, we can see potential for significant reversal of recent trends. There remains considerable uncertainty over the state of Chinese capital markets. And central banks may move to more accommodative policy settings. On the other hand the deep falls in commodity prices and likelihood that they remain depressed for the foreseeable future is likely to weigh-in to prevent a sustained recovery in risk appetite.
Chinese data watch
China activity indicators next week are likely to be watched closely. The trade figures released on Wednesday were stronger than expected in most respects, including showing a surprising jump in key commodity imports. As such, they may have helped cool negative sentiment towards China.
Strong Australian labor data
The Australian labour market also continued its strength into the end of the 2015. And while the AUD has recently and should be reactive to commodity prices, it is not an easy short. The RBA is likely to remain on hold for some time yet. The evidence from the labour data suggests growth in non-mining sectors is more than compensating for the job losses in the mining sector.
AUD has thus gained some yield support vs. the USD recently. Should market and economic concerns around China ease and/or the Fed moves to dampen rate hike expectations, the AUD can also rebound.
This is not our base case, but the AUD and US equites are trading near 2015 lows, and risk reward does not favour aggressive shorts at this time.
What they said
St Louis Federal Reserve President James Bullard (centrist on hawk/dove spectrum):
“With renewed declines in crude oil prices in recent weeks, the associated decline in market-based inflation expectations measures is becoming worrisome”
“Headline inflation will return to target once oil prices stabilize, but recent further declines in global oil prices are calling into question when such a stabilization may occur.”
“Automobile sales, for instance, have been strong,” … “More generally, real personal consumption expenditures growth accelerated during the period of the large drop in oil prices from mid-2014 to mid-2015. This could be viewed as mild evidence that the oil price decline is a bullish factor for the U.S.”
Fitch Ratings Agency
“The pace of house-price growth should decelerate particularly sharply in Australia and New Zealand this year; while the decrease should continue in Singapore, with prices dropping by a further 5 per cent from last year,” it says.
Fitch forecasts growth of about 2 per cent in Australia in the coming year and about half that in New Zealand. For Australian capital cities that is well down on the 8 per cent average annual growth enjoyed over in the last three years, according to CoreLogic RP data. (Property market to hit the brakes in 2016 – SMH.com.au)
Charlene Chu a partner of Autonomous Research Asia Ltd, the former Fitch Ratings analyst known for her warnings over China’s debt risks
China is nowhere close to reining in its debt problems,” …. “It is one of the key factors weighing on GDP growth and one of the reasons why foreign investors are so concerned about China’s trajectory.”
Louis Kuijs, head of Asia economics at Oxford Economics Ltd in Hong Kong
“Some of the recent policy moves on the stock and foreign- exchange markets are indicative of tension between the leadership’s desire for market-oriented reform and the apparent fundamental objective of control by the government and, ultimately, the Party,”
It doesn’t work squeezing speculators on a currency for long, they soon learn to roll out their bets well beyond the front of the curve, and no government can afford to keep punitive rates in place for very long without causing a severe economic crunch.
Economic News in the last week
Australia:
Employment -1K in Dec, somewhat stronger than -10K expected, revised up a bit from 71K to 75K in Nov. Full-time jobs rose 17.6K, part-time fell 18.5K.
Unemployment 5.8%, stronger than 5.9% expected, unchanged from 5.8% in Nov, the low since Oct-13. Participation rate 65.1, weaker than 65.2% expected, but dipping from a peak (65.3) since Sep-12.
Another solid employment report with jobs growth averaging 43K over three months, 31.8K over six months and 25.1K over 2015. Employment rose a strong 2.8% 3mth-yoy in Dec, the strongest rate since 2010. Total hours worked rose 3.3% 3mth-yoy in Dec

Job Vacancies rose 3.5% in the three months to Nov over the previous three months, and were revised up to 3.5%q/q in Aug from 2.7%.
Job ads fell 0.1%m/m in Dec, after rising 1.1%m/m in Nov, revised down from 1.3%. They rose 10.0%y/y, growing at around this strong rate through 2015. Dec was the first monthly fall since July after recent strong gains.

New Zealand
Retail sales card spending fell 0.2%m/m in Dec, much weaker than +0.5%expected, after rising 0.2%m/m in Nov, revised down from 0.3%. Sales slowed to 4.6%y/y in Dec from 4.9%y/y in Nov, the slowest rate since May.
Core retail sales fell 0.4%m/m in Dec after rising 0.3% in Nov. Core sales slowed to 5.3%y/y in Dec from 6.2%y/y in Nov.
Building Approvals rose 1.8%m/m in Nov, after rising 5.4%m/m in Oct; up 17%y/y (seasonally adjusted). The trend rate of growth was 0.6%m/m in Nov. Overall still growing at a moderate to solid rate.
Truckometer (heavy road transport traffic volume) rose 2.6%m/m in Dec, up 1.4% on average of the last three months, the fastest 3m avg since Sep-2013.
ANZ monthly inflation gauge rose 0.2%m/m and 0.3%q/q. ANZ said the results suggest “non-tradable and core inflation readings will remain well below the RBNZ’s target mid-point [2%] for a while yet.”
USA
Weekly jobless claims rose from 277K to 284K last week, above 275K expected. This is the second rise above 280K in the last three weeks, and suggests that there has been some modest deterioration in the labor market over the last two months. The four-week moving average (279K) was at a high since July.
Weekly consumer confidence firmed a bit from 44.2 to 44.4 last week, rising for six weeks from a low in 2015 and end-Nov, to a high since mid-Oct. Basically holding at a relatively stable rate near the high since 2007, but down a bit form the peaks in Q1.
Eurozone
Industrial production rose 1.1%y/y in Nov, weaker than 1.3% expected, down from 2.0% in Oct.
Japan
Machine orders fell rose 1.2%y/y in Nov, weaker than +6.3%y/y expected, down from 10.3%y/y in Oct. A volatile indicator, showing little clear trend. They rose 3.3%y/y on average over the last three months, down from 12.9% mid-year, but up from lows a year ago of -4.1%y/y.
Current Account balance JPY 1.42 tn in Nov seasonally adjusted, a bit below 1.51 tn expected, down a bit from 1.49tn
China
Exports fell 1.4%y/y in USD-terms in Dec, stronger than -8.0%y/y expected. The three month average growth was -5.0%y/y, not yet showing clear evidence of rising.
Imports fell 7.6%y/y, stronger than -11.0% expected. The three month average growth was -11.7%y/y.
Imports of iron ore by volume rose sharply to 96.27mt in Dec. Averaging 84.64mt per month over the last quarter, up 8.6% 3mth-yoy. After two years of a flat rate of imports averaging under 80 mt, this is a significant rise.
Crude oil imports rose sharply to 33.19 mt in Dec. Averaging 28.96mt per month over the last quarter, up 8.8% 3mth/yoy; continuing a steady rising trend over the last two years.
Copper imports also surged into Dec reaching a high since Jan-2014. They rose 14.7% 3mth/yoy in Dec.
Coal imports by volume averaged 15.93mt per month in Q4, down 30.1% 3mth/yoy.
The trade data were better than expected and showed surprisingly strong commodity demand, hardly consistent it the weaker trend in commodities recently. The data may have been distorted by an early build up in inventory ahead of the Chinese New year on 8 Feb, vs 19 Feb in 2015