QE come-back and regional forces drive JPY
The rise in USD/JPY is surprising many, breaking away from US yields and perceptions that JPY should act as a safe haven in times of global market uncertainty. However, the USD/JPY 10-year yield advantage is around a high since 2007 and consistent with a weaker JPY in a broad sense. JPY assets have been behaving more like Asia regional assets. BoJ QE continues apace, while the Fed is now in QT. Real yields have widened significantly in favour of the USD, especially if you consider rising wages in Japan. JPY may be evolving from a safe haven to a regional currency. BoJ QE policy may also be reasserting a negative influence on the currency.
JPY breaking away from US yields
An interesting development is the run-up in the USD/JPY to new highs, breaking above what some people see as a three-year downtrend, even though US yields have moved sideways in the last month.
The USD/JPY had appeared to re-connect with US yields since around March, after a period of disconnect in the first months of the year.
The USD/JPY had been incredibly tightly correlated with US yields (or the yield spread as shown in the chart below) from around mid-2016 to end-2017.
As such the market has gotten used to seeing USD/JPY and 10-year yields as moving in unison in recent years.
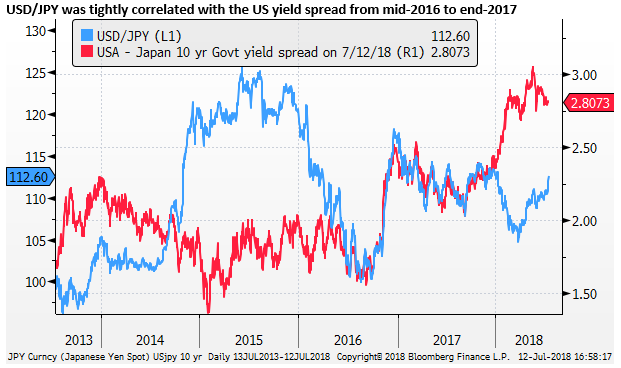
However, the chart above also shows that there was a significant divergence between the USD/JPY and yield spreads from early 2014 into the first half of 2016. This may have reflected the adjustment in USD/JPY to the relative pace of QE between the Fed and BoJ.
QE drove JPY from 2012 to 2016
The BoJ really entered the QE game in a big way following the election win by PM Abe in late 2012. Abe promised to revamp the BoJ and kick-start QE, and did so by appointing BoJ Governor Kuroda in 2013. Kuroda implemented his version of “QQE” in April 2013, and drive USD/JPY from record lows below 80 in 2012 to 105 by end 2013.
The USD/JPY then ran out of puff for much of 2014, until Kuroda decided to shock the market with a further expansion of its QE asset purchases, driving USD/JPY to new highs above 120 by late-2014 and for much of 2015.
As such from 2012 until 2016, the USD/JPY was for the most part driven by the adjustment to BoJ QE policy.
QE fatigue in 2016
In 2016, the market began to run into fatigue on BoJ QE policy, doubting that it was working to generate inflation, and predicting that the Japanese government and BoJ would lose patience with its perpetual soaking up of JGBs. It seemed as if the BoJ was out of bullets and it proved reluctant to further expand its QE asset purchases even as USD/JPY fell.
More generally, the market was growing to doubt that QE policy could achieve its goal of generating inflation, and it was fearing the unintended consequences of negative interest rates and flattening bond yield curves on bank profits and financial intermediation.
In this environment USD/JPY fell through much of 2016, unwinding a good deal of its QE induced rise in 2014/15.
In Sep 2016, grasping for new ideas, the BoJ introduced its policy of “yield curve control”, targeting 10-year yields around zero, a policy it retains to this day.
This may have helped stabilize the USD/JPY, and by late 2016 it started to rise again as the US economy started to show more strength and the Fed resumed its rate rises in December 2016, a full 12 months after its first hike in December 2015.
Since 2016, USD/JPY has lost its fascination with BoJ QE, responding more to US yields.
Is QE coming back as a factor for JPY?
So far this year, USD/JPY has become much more loosely related to US yields. QE has been forgotten since 2016; perhaps it is returning again as a factor contributing to recent weakness in JPY.
The Fed ended its QE purchases in 2014, holding its balance sheet steady at around $4.5 tn until Q3 last year when it began QT (reducing its balance sheet, at a preset, but increasing pace this year).
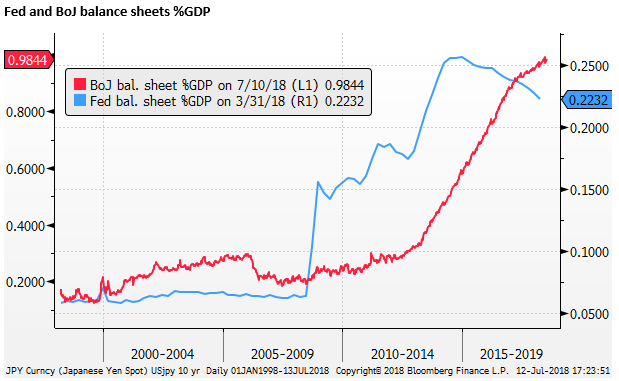
The BoJ has reduced its pace of purchases somewhat since implementing yield curve control in Sep-2016, capping 10-year yields below 10bp. Nevertheless, as a percentage of GDP, the BoJ’s balance sheet has continued to grow, reaching close to 100% of annual GDP.
The Fed’s balance sheet has been declining as a percentage of GDP since 2014; at an increasing rate since Sep 2017 when it began QT.
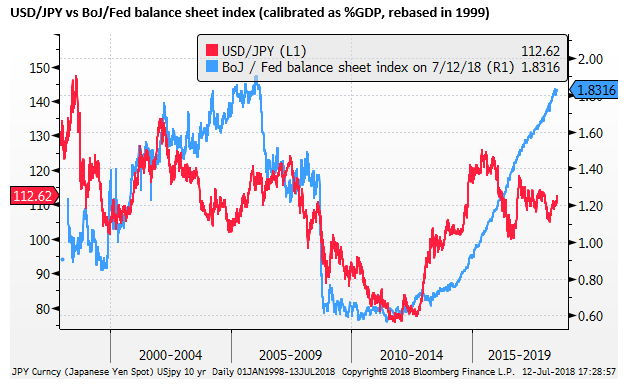
The diverging size of their balance sheets could be coming back into the equation for USD/JPY. The chart below compares the USD/JPY to the relative size of the Fed and BoJ balance sheets. Our starting point is before 2000, to take in the full picture of balance sheet policy action.
The BoJ was actually the pioneer in QE, targeting banks’ reserves on deposit at the central bank for the first time in 2001; although far less aggressively than the latter-day QE since the 2007/09 Global Financial Crisis.
Our relative balance sheet is generated by using central bank total assets as a percentage of GDP, rebased in 1999, a time before QE policy had been used by either central bank. By this measure, BoJ’s balance sheet expansion since 1999 is around 1.8 times that in the USD.
How central bank balance sheets might affect exchange rates is far from clear, arguably, in the end, it should depend on their impact on asset prices not on the size of the balance sheet per se.
The chart above shows that the relative balance sheet size calibrated for GDP and the historic norms before 2000. On this metric, the BoJ balance sheet is roughly back to its high in comparison to the Fed’s balance sheet in 2006.
However, both central banks really ramped up QE after the GFC. The Fed started first in 2008, the BoJ followed in 2013.
The Fed expanded its balance sheet from 6% of GDP to over 25% at its peak in 2014. The BoJ expanded its balance sheet from around 15% of GDP in 1999 to near 30% in 2006, reduced it in 2006 back to around 20%. From 2008 to 2012, it expanded it again to around 30%, then more rapidly from 2013 to near 100% this year.
The impact of QE might not be linear, and it might seem that the BoJ has taken its QE to a new extreme relative the Fed in the post-GFC era. The chart below shows the difference in balance sheets as a percentage of GDP. By this measure, the BoJ has extended QE far more aggressively than the Fed.
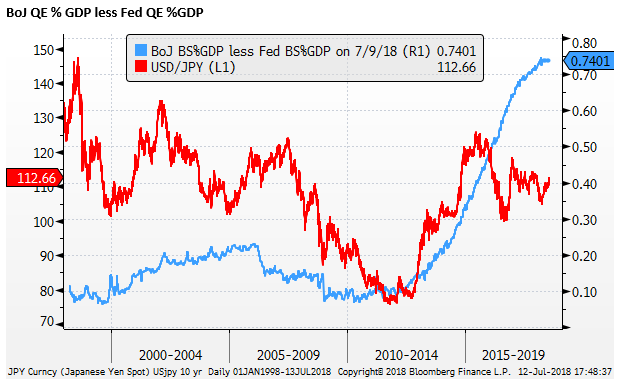
If the market is returning to consider relative QE, then it is possible that USD/JPY could move significantly higher again.
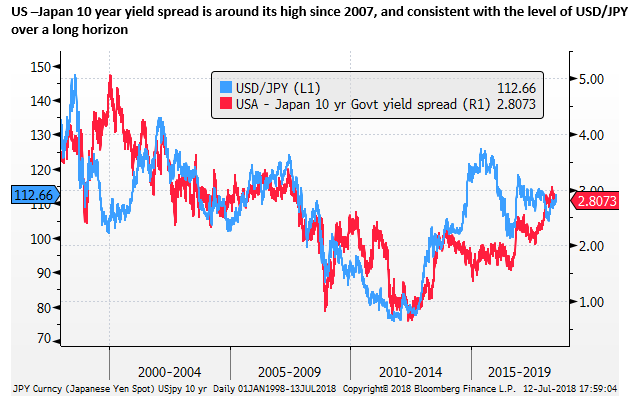
USD/JPY is supported by the rise in the yield spread to around a high since 2007
The direct impact of QE may be psychological. It appeared to make a big difference in 2013/2015. Theoretically, it should work more clearly through its impact of asset prices and real rates of return. In the case of Japan, BoJ QE is keeping yields down and stable below 10bp. US yields have risen much further in the last two years.
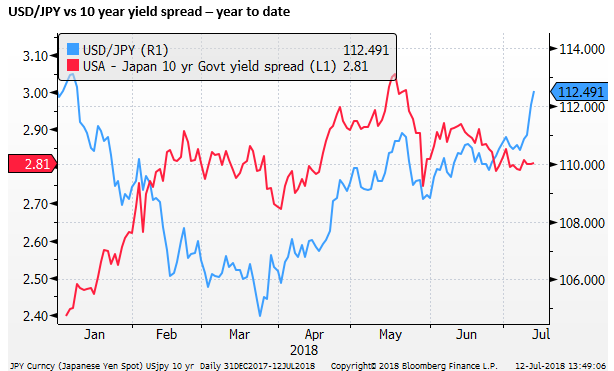
In a broad sense, the 10-year yield spread is back to it around its widest since 2007 and this may be enough to support further gains in USD/JPY.
USD/JPY fell significantly in Jan/Feb this year, despite a surge to new highs in US yields, in the context of broad weakness in the USD. Its rise in recent months is reversing this earlier decline, re-connecting with the higher level of US yields that retain most of their gains in Jan/Feb, even if they have eased recently.
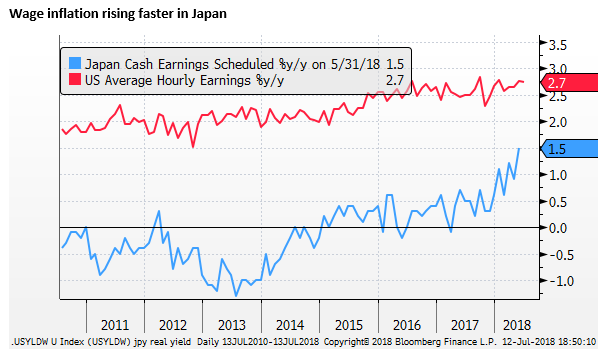
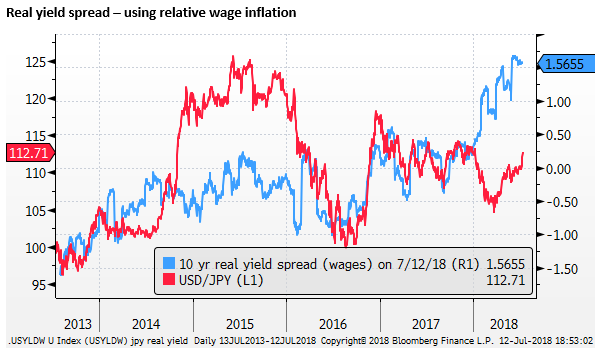
Rising Japan wages suggests BoJ QE is working
If we consider real yields, and we use wage inflation to deflate 10-year government nominal yields, then the BoJ QE policy has worked to depress real yields in Japan far more than in the US.
The Japanese labour market has tightened significantly and appears to be generating a bigger increase in wage inflation than most other countries, albeit from a lower base. US wage growth has also increased but more modestly.
If we use these wage indicators to deflate 10-year nominal yields, then the real yield differential for the USD has risen significantly, by around 1.2% this year, and might argue for a much higher USD/JPY.
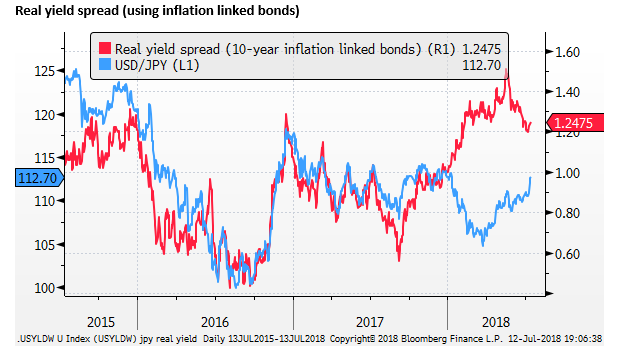
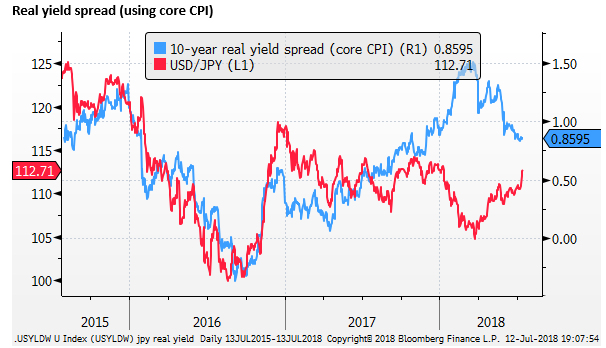
Real yield spreads and the JPY
The more standard measures of the real yield differential, using core CPI to deflate yields, or inflation-linked bonds to calculate a market-based measure of real yields, have not risen as much.
In fact, they have declined in recent months. However, they are still significantly higher over the last year, and the recent rise in USD/JPY may be playing catch-up from its falls earlier in the year.
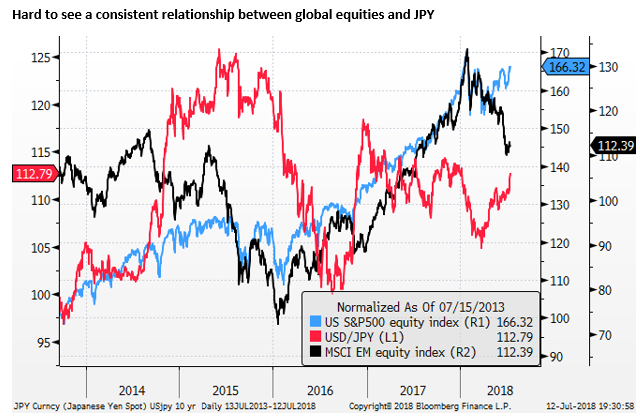
Hard to see a consistent relationship between global equities and JPY
JPY has traditionally been considered as a safe-haven; rising when global asset prices are weakening. To some extent, this also comes through bond yields, since risk aversion generally results in lower global bond yields and a lower USD/JPY yield advantage.
In fact, the relationship between JPY and global equities has been rather mixed in the post GFC era. The fact is that JPY is not as routinely used as a funding currency for ‘risk-on’ trades as it was before 2007.
As discussed already, the JPY was highly correlated with the bond spread throughout 2017, and it paid little attention to the consistent strength in global equities. In fact, up until January this year, broad USD weakness was associated with rising global equities, and the JPY participated in this move. As such, USD/JPY fell despite a ‘risk-on’ mood.
The USD/JPY made a low for the year in March, and this may have reflected broad market equity upheaval.
In recent months, the JPY has tended to ignore further upheaval in EM equities. On the other hand, US equities have been generally recovering. As such, there has not been widespread risk aversion. The environment has been more mixed.
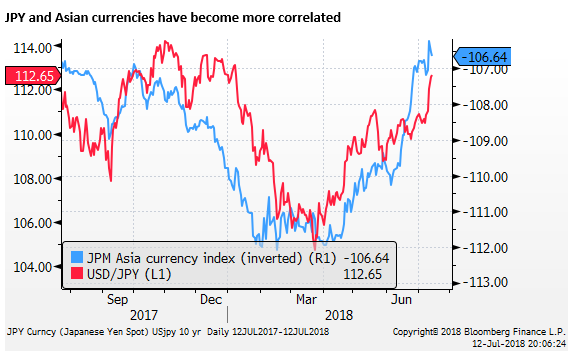
JPY reacting to tariff threats, like other Asian markets
The most recent fall in EM assets has been driven to a significant extent by the US-China trade war, and some lost confidence in the Chinese economy. Asian currencies and equities have fallen significantly in the last two months. Instead of acting as a safe-haven, the JPY became more closely aligned to Asian currencies and assets.
The chart below shows that the recent fall in JPY is consistent with weaker Asian currencies, albeit playing catch-up in the last week to falls in Asian currencies over the last month.
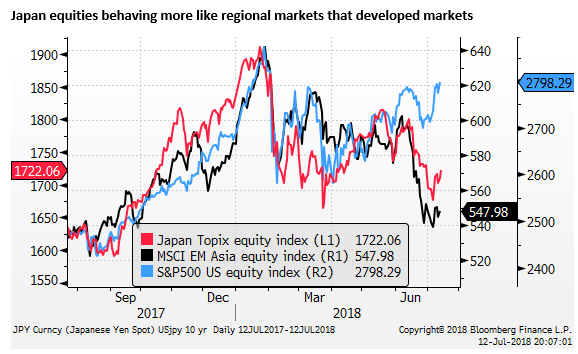
Similarly, Japanese equities have looked a lot more like Asian regional equities rather than developed market equities in the last two months.
In the past, the Japanese stock market was frequently negatively correlated with JPY, where a weaker JPY was seen to boost Japanese export revenue and inflation expectations.
However, the reverse is true in the last month or so, JPY has been positively correlated with Japanese equities; in that, they have both fallen in unison. This is the normal reaction in Asian regional markets and again suggests that JPY is responding to regional investor sentiment.