RBA more nervous over China outlook
The US labour data were strong enough along with faster wage growth to generate discussion of rate hikes beyond the now very probable December hike. This has pushed two-year US rates to a new cyclical high, widening the USD yield advantage in particular against the EUR and JPY to new cyclical wides. The US economy is showing resilience to weaker emerging markets and a weaker energy sector and should continue to support the USD into next year. The Chinese trade data continues to show pressures on external and internal demand. Iron ore import volume was weaker and combined with a steady decline in Chinese steel prices and production, point to a weaker outlook for the AUD. The RBA has downgraded its view on China in recent months acknowledging that heavy industrial sectors may be weaker than the official industrial production data suggest, and worrying that Chinese government efforts to support fixed asset investment in the last year have failed to arrest the decline. The Australian employment and Chinese activity data will be key for near term direction in the AUD.
RBA more nervous over China outlook
The RBA, released in its Statement of Monetary Policy on Friday, has come up with its own measure of industrial output for China that is much weaker than the measure that receives most attention in the financial markets. They are calling it gross output and it is based on the “more granular data” published by China including “tonnes of crude steel, the number of automobiles, and so on”
The RBA SoMP said, “Since 2011, growth in gross output has been lower on average and more variable than growth in industrial value added. This has become particularly pronounced since late 2014.” In fact the index is in out-right declined over the last year by around 2% eye-balling their chart, see below.
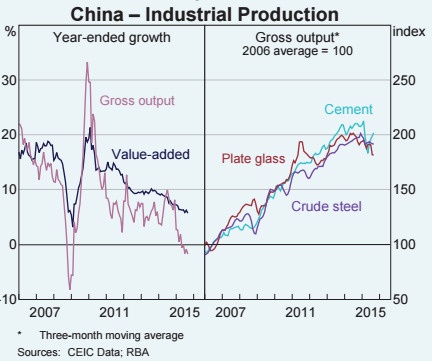
(Box A: China’s Industrial Sector – RBA.gov.au)
The RBA said, “The data suggest that falls in the output of machinery, equipment and some construction-related products, including crude steel, cement and plate glass, have been particularly pronounced.” All products that used mostly in residential construction.
It further backs up this analysis by noting that industrial revenue and profits are flat to declining over the last year.
The RBA’s report also highlights the dichotomy of performance with most of the declines in industrial activity and profitability in the North Eastern region. The concentration of down-turn to this region is a cause for concern in itself, because the more intense financial stress in one region increases the risk of contagion through the financial system to the rest of the country.
The RBA said, “If conditions in one part of the country were to deteriorate significantly, financial institutions with sizeable on- and off-balance sheet exposures to that region may come under pressure, potentially requiring policy responses to mitigate the spread of risks to the broader financial system.”
The RBA’s commentary on China in its statements this week displays a higher degree of concern than in previous statements. The RBA downgraded its outlook for its major trading partners in its latest November Statement on Monetary Policy (SoMP) from “around its long-run average” to “slightly below its decade average” over the next two years. But more significantly it noted a much higher degree of downside risks to this forecast.
It said, “The outlook for growth in the Asian region is a key source of uncertainty for the forecasts. The Chinese authorities have taken steps to support growth, and have scope to ease policies further. It is possible, however, that the slowing in the industrial sector will broaden to other parts of the economy that have been relatively resilient to date.”
This discussion of concentrated regional down-turn first appeared in the minutes of the October policy meeting. Although the November Policy statement more clearly sets out the risk this poses to overall financial and economic stability.
In the risk section of the SoMP, the RBA also appears to be losing some confidence that Chinese policy measures designed to mitigate the down-turn will work, since they have failed to make much difference so far.
It said, “Policymakers have responded to concerns about lower growth in economic activity by easing monetary policy and approving additional infrastructure investment projects, and they have scope to provide further support. Even so, given the relatively muted response of investment growth so far to the range of initiatives undertaken since late 2014, there is uncertainty about how effective current policies will be in supporting growth in the next few quarters.”
Chinese trade data point to ongoing pressure on internal and external demand
Chinese trade data suggest no relief for Australia with weaker imports of iron ore and coal volumes, coincident with weaker prices and steady decline in steel production.
Total Chinese Imports fell 18.8%y/y in USD-terms in October, weaker than -15.2% expected, up from -20.4%y/y in Sep, setting a new low three-month moving average annual decline since 2009.
Imports of iron or by volume were down 4.9%y/y in October and down 1.4% 3mth-yoy, suggesting there is false hope of a turn-up in volume of ore imports after the three month year-on-year average rose to +1.7%y/y in Sep a recent high.
Imports of Iron ore from Australia were running above those of other countries, but they too have slipped back over recent months closer to the total for China imports; the data for a month behind the total rose 3.1%3mth-yoy in Sep, the lowest since 2011.
The trade data in China suggest that any rebound in the AUD from its decline on Friday should be limited. This week, the market will be waiting for the Australian labour report and the monthly activity indicators from China. The RBA has expressed a certain amount of confidence that the labour data is on a firmer footing this year supported by a recovery in service sector jobs, and this may encourage some short covering. However, the Chinese commodity price trends and heavy industry down-turn that has yet to show any evidence on pulling up suggests downside risk for the AUD.
At issue for China’s steel industry in greater push back from countries abroad over rapid growth in Chinese steel exports over the last two years. Chinese exports of steel also fell back in October; slowing from +32.1%y/y in Sep to +5.5%y/y in October. There have been increasing calls from producers in Europe to governments to crack-down on unfairly traded steel. If Chinese export markets are feeling saturated, it may fall back on Chinese producers to cut production more significantly.
US labour data suggests economy remains robust
The US labour data were much stronger than expected, suggesting that there may have been a pause in hiring in Aug/Sep during global market upheaval, and a catch-up rebound in September. Job gains in Oct of 271K were the highest since Dec-2014. The average for last three-months was a healthy 187K. Perhaps more significantly the unemployment rate fell to a new low since 2008, as did the broader U6 measure, both suggesting little slack left in the labour market. That perception is further backed up by stronger wage growth; up to a high since 2009.
The data exceed that required to make the FOMC case to begin its policy rate hikes in December. They are firm enough to breathe life into the prospect of further rate hike expectations next year which should keep the USD on a rising trend.
What they said
- Khalid al-Falih, chairman of the state-owned Saudi Arabian Oil Company (Saudi Aramco): “There have been no conversations here that say we should cut production now that we’ve seen the pain.” Suggesting SA has no plans to cut production to support prices despite the rapid deterioration in its government budget and declining International reserves.( Saudi Arabia will not stop pumping to boost oil prices – FT.com)
In the news
- Steel Industry representatives in Europe have called for “immediate” measures against what they perceive as unfairly traded steel products, particularly from China, which they say are driving down prices. (EU steelmakers call for tougher action against Chinese imports – FT.com)
Economic news
- Japan Labour Cash Earnings rose 0.6%y/y in Sep, more than 0.5% expected, up from 0.5%y/y in Aug, revised up from 0.4%. Core contracted regular earnings rose 0.4%y/y in Sep, after rising 0.2%y/y in Aug. A somewhat stronger than expected result, but core earnings have risen between 0.2 to 0.4%y/y since March and are yet to clearly accelerate. Somewhat supportive for JPY, keeping the BoJ from easing policy further.
- Australia: ANZ job ads rose 0.4%m/m in October, a strong result after gains of 3.8% m/m in Sep and 1.3%m/m in Aug; the fastest three months of gains since Aug-2014, consistent with the RBA’s more sanguine view over employment growth in its policy statement last week.
- China: Exports fell 6.9%y/y in USD-terms in October, weaker than -3.2% expected, down from -3.7%y/y in Sep, remaining around this pace of decline since April.
- Imports fell 18.8%y/y in USD-terms in October, weaker than -15.2% expected, up from -20.4%y/y in Sep, setting a new low three-month moving average annual decline since 2009.
- China: Iron ore import volume fell 4.9%y/y in October, down from +1.7%y/y in Sep. Coal import volume fell 30.7%y/y in October after falling 16.0%y/y in Sep. copper import volume rose 5.8%y/y in Oct, down from +16.7%y/y in Sep
- China import value from Australia fell 23.8%y/y in October, up from -27.3%y/y in Sep. Import value from Brazil fell 4.4%y/y in October, up from -7.1%y/y in Sep. Imports from ASEAN fell 24.0%y/y in Oct, up from -26.6%y/y in Sep. Imports from Japan fell 15.0%y/y in Oct, up from -19.3%y/y in Sep. Imports from the EU fell 23.4%y/y in October, down from -14.3%y/y in Sep Imports from the UK fell 44.3%y/y in Sep, down from -15.6%y/y in Sep. Imports from the USA rose 3.6%y/y in Oct, up from -8.8%y/y in Sep.
- USA: payrolls rose 271K in Oct, well above 185K expected. Net revisions to the previous two months were +12K. This was the largest monthly increase since Dec-14. It helps reverse the weaker results in the previous two months, leaving the three-month average at 187K. The average jobs growth this year has been 206K, down from the peak year since the great recession of 2008/09 of 255K last year. There may have been a lull in hiring in Aug/Sep during global market uncertainty that has calmed in the last month, seeing a catch up in job growth in October.
- The unemployment rate fell from 5.1% in Sep to 5.0% in Oct, stronger than 5.1% expected, a new cyclical low. The broader U6 under-employment rate also fell to a new cyclical low of 9.8%. Both indicate tightening in the labour market has continued. The participation rate was steady at 62.4%, a low since the 1970s.
- Average hourly earnings rose 2.5%y/y in Oct, stronger than 2.3% expected, up from 2.3%y/y in Sep, revised up from 2.2%. This is the strongest rise since 2009, including on a three-month average basis (2.3%).
- US consumer credit rose $28.9bn in September, stronger than $18bn expected, after rising $16bn in August, the largest monthly increase on record.
- Canada: Employment rose 44.4K in October, above 10K expected. Job gains may have been boosted by election hiring, driven by a 35.4K rise in part-time jobs. The unemployment rate fell from 7.1% to 7.0%, stronger than 7.1% expected, up from 6.5% at the beginning of the year.
- Canada: Building permits fell 6.7%m/m in Sep, weaker than expected. Down 6.0%y/y. Residential approvals fell 11.6%. Apartment approvals fell 20%m/m, single permits fell 3.7%m/m.
- German industrial production rose 0.2%y/y in Sep, weaker than +1.3% expected. Spanish IP rose 3.8%y/y in Sep, above 2.8% expected.
- UK industrial manufacturing production fell 0.6%y/y in Sep, weaker than -0.7% expected
- UK total trade balance was -GBP9.35bn in Sep, narrower than -10.6bn expected, and -10.79bn in Aug, aided by stronger exports to non EU countries.
Markets on the Move
- US 2yr swap rates rose around 8bp after the data and are 2bp firmer in Asia this morning. At 1.005% they have breached the previous high close for the year in June, a 34bp rebound from the low on 14-October (very close to the low for the year).
- Eurozone 2yr swap rates rose less than 2bp on the US payrolls data to be -0.105%.
- UK 2yr swap rates rose 6bp on the US data, to be up 4bp on the day, reversing the fall after the BoE Inflation report on Thursday.
- New Zealand 2yr swap rates are up 6.5bp in Asia on Monday, reflecting the US move, after being down by 1.5b last week on the weaker NZ labour data and lower milk price.
- Australian 3yr government bond yields are up 9.5bp in Asian on Monday. 2yr swap rates are up around 7.5bp from the close last Thursday, reflecting the rise in US rates.
- Canadian 2yr swap rates were up 5bp on Friday after the US data.