Strength in the AUD may be fleeting
The smart money has decided there will be no rate cut today by the RBA and the AUD has firmed ahead of the announcement. But there are reasons for the RBA to put a cut back on the agenda and renewed price falls in its key commodity markets may encourage the RBA to re-instate a preference for a lower AUD. Strength in the AUD on a no cut announcement may be fleeting and it is likely to fall if the RBA inserts even a modest easing bias into the statement.
Reasons for the RBA to revert to an easing bias
The Australian rates market has convinced itself there will not be a rate cut today mainly because there has not been any sage newspaper reporter predicting one, and some of the more prescient economists are suggesting not enough has changed to warrant a cut after a relatively neutral policy statement one-month earlier at which the RBA noted improvement in non-mining sectors of the economy.
There are three key developments since the previous RBA meeting that have raised the prospect that the RBA may cut rates again. Large banks have raised their variable mortgage rates by between 10 to 20bp, the CPI inflation data was significantly lower than expected, and Australian commodity prices have weakened, threatening to make new lows.
In light of these developments, even if the RBA leave rates on hold today, it may insert an easing bias into the report and it may re-engage in talking the exchange rate lower.
RBA may re-engage in currency jawboning
In the 6 October policy statement the RBA said: “The Australian dollar is adjusting to the significant declines in key commodity prices.” In the minutes from this meeting, released on 20 October, it said, “This rebalancing [from resources to non-mining] was being increasingly supported by the depreciation of the Australian dollar, which had led to a noticeable increase in net service exports over the past year.”
These somewhat up-beat assessments helped support the AUD after the last meeting. The chart below shows the AUD TWI, AUD/USD and CBA Australian commodity price index.
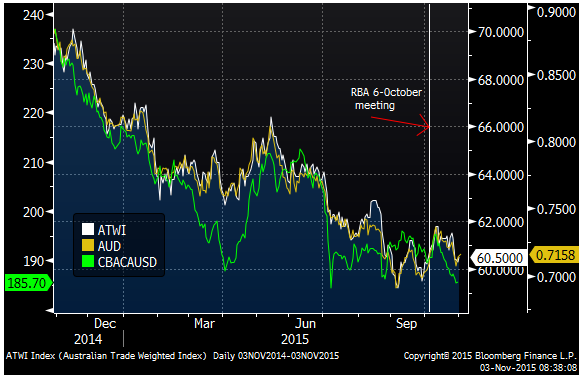
The AUD is little changed since the previous meeting and commodity prices are somewhat lower. Perhaps ominously commodities are retesting the lows for the year, threatening to undermine sentiment more significantly as the market links weaker commodity prices to reports of weaker than expected industrial production and fixed asset investment in China.
The RBA does not need to express alarm over the level of the exchange rate, but given the recent trends in resource sector assets it might want to highlight the need for a sustained period of a lower exchange rate to support non-mining sectors.
Lower inflation outlook
The key underlying trimmed mean (2.1%y/y) and weighted median CPI (2.2%y/y) inflation measures came in 0.3ppt below expected on their annual rates in Q3, dipping a bit to near the lower part of the RBA’s 2 to 3% target range for inflation, rather than rising to the middle of the band as was expected. This lower starting point for inflation should bring down the RBA inflation forecasts somewhat that are to be updated on Friday in the quarterly Statement on Monetary Policy (SoMP).
In its August SoMP, the RBA forecast year end inflation at 2.5%, and in a range of 2 to 3% over the three year horizon.
In its most recent 6 October policy statement, the RBA said, “Overall, the economy is likely to be operating with a degree of spare capacity for some time yet, with domestic inflationary pressures contained. Inflation is thus forecast to remain consistent with the target over the next one to two years, even with a lower exchange rate.”
The view on inflation was benign and has received little attention in RBA statements. The most recent CPI data may open the door for the RBA to insert an easing bias into their report. The RBA may be reluctant to make it seem that a policy cut hangs on the last CPI release, but it could note the data do raise the possibility that inflation trends are lower than previously forecast.
Linking policy to progress on financial stability
The RBA acknowledged tentative signs that the housing market and bank lending were beginning to respond to prudential tightening at its previous meeting. Evidence on the housing market over the last month has continued to show cooling in sales and prices in the major cities. Building approvals released yesterday were also showing evidence of peaking. However, overall lending growth to the sector was little changed at a solid although not alarming annual rate of around 7.5%.
In light of the rise in bank variable rates we might expect further moderation in the housing market. However, if the RBA were to cut rates so soon after this tightening in credit conditions that have only just started to dampen housing market activity, it might appear overly sensitive to the sector and send confusing signals to the market in which it would probably prefer further moderation in lending.
It’s a difficult balancing act for the RBA; it may prefer housing moderation, but it wants stronger overall economic growth, particularly in the non-mining sector. It has accepted that cutting rates over recent years would boost housing investment and activity and this was intended to be a part of supporting economic rebalancing during the resources sector down-turn. But it stoked excessive growth in investor lending to the sector and rapid price gains in the major cities from already high levels. The RBA has acknowledged that households have limited capacity to further extend borrowing.
The answer has perhaps always been greater use of prudential measures to control lending, and arguably the regulators were too slow to act decisively. But now they have acted, it appears too early to presume enough momentum has been taken out of the housing market to allow some further rate cuts.
The RBA could make rate cuts appear more conditional on these financial stability concerns. It may note that it is paying closer attention to impact of recent prudential measures.
Markets on the Move
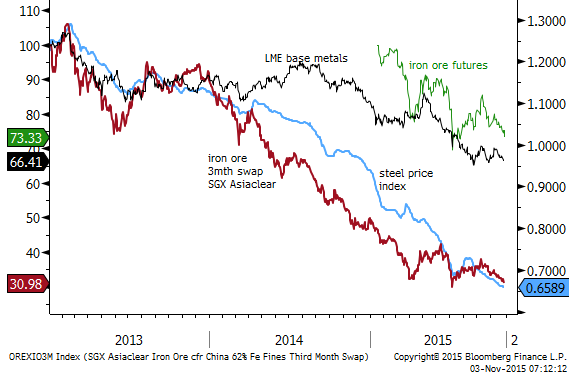
- Iron ore futures prices continued a steady decline on the Dalian Futures Exchange; the most active contract for Jan-16 fell 2.5% on Monday to a new low since July. The one-month SGX Asiaclear swap price fell sharply by $4.7 to $47.4 per metric tonne to around its previous lows for the year seen in April and July. The 12mth swap price fell $1.3 to $39.85 a new low in the contract since data available in 2009.
- Steel prices in China have continued their steady drift lower to around their lows since since data is available since 2003.
- The LME base metals index has fallen a bit further on Monday to a low since September, appearing to be bumping along the lows for the year in Aug/Sep.
- Coking and Thermal coal futures contracts in China were flat of down a bit, remaining at contract lows.

Economic news
- USA Construction spending rose 0.6%m/m in Sep, more than 0.5% expected, after rising 0.7%m/m in Aug. From a year earlier, it was up 14.3%y/y in Sep and has extended the rising trend from the lows in 2010 to the highest level since 2008.
- USA ISM manufacturing fell a bit from 50.2 to 50.1 in Oct, a bit above 50 expected. New orders rose from 50.1 to 52.9. However, employment fell from 50.5 to 47.6.
- USA Markit PMI manufacturing final reading for Oct was revised up from 54.0 to 54.1, up from 53.1 in Sep and a recent low of 53.0 in Aug.
- Canada RBC PMI manufacturing fell from 48.6 to 48.0 in Oct, a new low in data available back to 2012.
- Canada weekly consumer confidence rose from 57.5 to 57.9, continuing a steady recovery from a low in August of 52.0 to a high since Nov-2014
- Eurozone PMI manufacturing final was revised up from 52.0 to 52.3 in October, firmer than 52.0 in Sep, remaining in its 52.0 to 52.5 steady range since March.
- UK Markit PMI manufacturing rose sharply from 51.8 (revised up from 51.5) to 55.5 in Oct, a high since June last year, well above an expected fall to 51.3. The size of the move is large compared to the six months of stable readings just below 52 since April.
- Australian weekly consumer confidence index rose from 113.4 to 115.2, placing its 4-week moving average around the previous peaks of the last two years, close to its long run average.
- Australia manufacturing PMI fell from 52.1 to 50.2 in October. However, the three month average (51.3) and the six month average (50.1) are around their highs since 2010. The employment component fell from 50.7 to 49.2. The new orders component fell from 53.4 to 49.9.
- Australia: CoreLogic RP Data House Price index rose 0.2%m/m in October. From a year ago, prices rose 10.2%y/y, down from 11.1%y/y in Sep. This is still around the high growth rate seen recent years and too early to say there has been any significant cooling in price growth.
- Australia Building Approvals rose 2.2%m/m in Sep, more than 1.0% expected, but were revised down to -9.5%m/m in Aug, from -6.9%m/m. Private house approvals fell 1.9%m/m in Sep, after rising 4.1%m/m in August. The trend for this core segment is relatively flat over the last year; they are up 0.8% 3mth/yoy in Sep. Apartment approvals rose 6.1%m/m in Sep after falling 15.7% in Aug. They rose 31.5% 3mth-yoy in Sep, but were up only 0.8% 3m/3m-annualsied. The ABS trend data suggests this volatile component may have peaked around May this year.
- Australia TD Securities Inflation index was flat in October, up 1.8%y/y, down from +1.9%y/y in Sep. The trimmed mean was also flat m/m and up 1.7%y/y, from +1.6%y/y in Sep.
- Japan manufacturing PMI was revised slightly lower from 52.5 to 52.4 in October, still up significantly from 51.0 in Sep, at a high in 12-months.
- China: government sponsored manufacturing PMI was steady at 49.8 in Oct, below 50.0 expected. Remaining around its lows since 2012, just below the growth line of 50 for the last three months.
- China: Markit/Caixin manufacturing PMI rose to 48.3 in Oct, above 47.6 expected, from 47.2 in Sep, the first rise in four months to a high since June.
- China: government sponsored non-manufacturing (services and construction) PMI fell to 53.1 in Oct from 53.4 in Sep, a new low in this series, continuing a falling trend for the last 5 years.
- India: industrial production from its eight infrastructure industries index rose from +2.6%y/y to +3.2%y/y in Sep, a high since May. A sign of possible bottoming in the pace of activity that had slowed from around 6% in 2014 to almost flat around a low in April.
- India: Manufacturing PMI fell to 50.7 in Oct, down from 51.2 in Sep, to a low since 2013.
- South Korea CPI inflation rose from 0.6%y/y to 0.9%y/y in Sep, above 0.7%y/y expected. The core measure rose from 2.1%y/y to 2.3%y/y, above 2.1% expected
- South Korea manufacturing PMI was down a little to 49.1 in Oct from 49.2 in Sep. The last two months are up from a recent low of 46.1 in Jun, back to around its March level.
- South Korea export growth slowed to -15.8%y/y, a low since 2009, below -14.5% expected, down from -8.4%y/y in Sep. Import growth was -16.6%y/y, below -13.5%y/y expected, up from -21.8%y/y in Sep. The trade balance was $6.69bn, below $7.13bn, around its record high levels over the last six months.
- South Korea current account balance was $10.6bn in Sep. around a record high.
- Taiwan: manufacturing PMI rose to 47.8 in Oct, a high since May, from 46.9 in Sep. This is the second rise in a row from a low of 46.1 in Aug (a low in data available since 2012).
- Malaysia: manufacturing PMI fell to 48.1 in Oct, from 48.3 in Sep, still up from the low in Aug of 47.2, around the high since May.
- Indonesia manufacturing PMI rose to 47.8 in Oct, from 47.4 in Sep. relatively stable since June, up from a low for the year of 46.4 in Mar.
- Indonesia CPI inflation was down to +6.3%y/y in Oct, below +6.4% expected, from +6.8%y/y in Sep. Core CPI inflation was down a bit to -0.1%, below flat expected, from -0.05% in Sep.
- Thailand CPI inflation rose to -0.8%y/y in Oct, above -1.0% expected, up from -1.1%y/y in Sep. Core CPI inflation was little changed at +0.95% in Oct, as expected.