Taking stock on a confusing start to the year
After a volatile start to the year that has involved a significant downward revision to global growth expectations, we try to take stock of the major global market developments to attempt to develop a sense of the prevailing themes in the market. A key driver of global developments has been the price of oil; it made two almost identical lows on 20 Jan and 11 Feb. Through this phase of the year, global market uncertainty and volatility was at its highest in some years, sending many in the market looking for risk havens. In this environment JPY and gold have been strong performers.
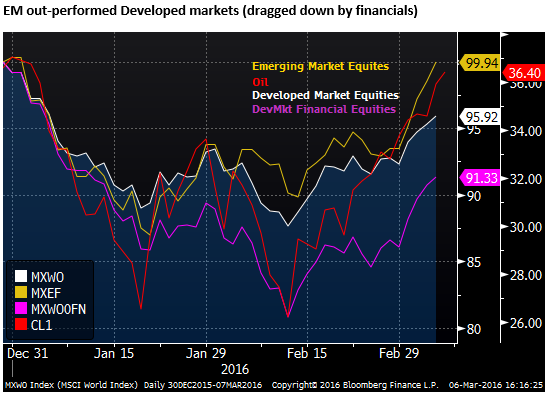
The second phase of the fall in oil prices from 29-Jan to 11-Feb was far more depressing for developed market assets. A key contributing factor was a deep fall in financial equites. In hindsight, we can see now that emerging market equities, commodity producer equites, including energy stocks, and many emerging market currencies were proving quite resilient during this second phase of intense risk aversion, many of them strengthening through this period.
After a double bottom the market appears more confident that the most recent rise in oil prices from the 11-Feb low is sustainable. The stronger oil price has reinforced the rebound in EM and commodity producer assets that were already appearing more inclined to recover from the earlier low in oil prices.
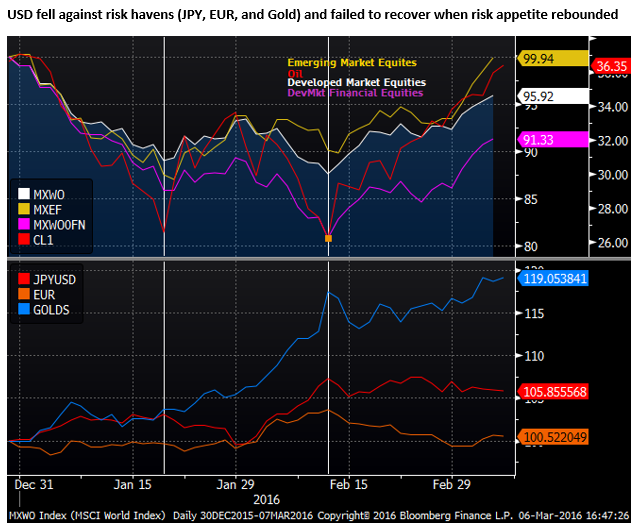
The persistent weakness in the USD against risk havens (JPY, EUR and Gold) is harder to explain during the solid rebound in global asset prices in recent weeks and recovery in US yields, amidst higher US inflation and strong US employment data. But the market has lost confidence and visibility on the outlook for monetary policy in Japan and Europe, fears they are running out of policy options, and appears more assured that Fed policy will adopt a more growth friendly demeanor. We doubt broad-USD weakness will persist but the onus appears to be on the US data to confirm it is on a sustainable growth path and generating higher inflation.
Fears over oil and China diminish
The market is confident OPEC and non-OPEC members will freeze output at January levels. US oil production has retreated a bit further from record levels set in July last year, and US refiners oil demand lifted suggesting US demand has picked up. Iran oil production has also not lived up to its timeline for returning to expected production levels.
Iron ore and steel prices in China have continued a recovery from lows in December last year. It is unclear if this reflects an improvement in Chinese demand. It is difficult to reconcile this with still declining economic indicators in China.
However, property prices are reported to have risen sharply in the big Chinese cities. The Chinese government has eased monetary policy, ensured the CNY currency is more stable since around the Chinese New Year, has announced more fiscal stimulus, and Chinese loan growth has surged in the first months of the year.
The Chinese government has perhaps shifted the balance of policy somewhat back towards supporting growth, encouraging credit creation and infrastructure spending. Slowing its progress on its longer term goals of rebalancing growth more towards the service sector and higher technology industries, controlling excess lending and reducing capacity in steel, cement and other heavy industries that supported rapid construction of housing and infrastructure.
The balancing act in China continues and it certainly intends to continue rebalancing its economy, but some of its recent policies support infrastructure and housing construction, allow for easier credit financing for local governments and this may have reduced fear of a further sharp fall in commodity demand this year.
In any case, industrial metals have been rising for around three months, and accelerated in the last month. Fear surrounding a hard landing in China is substantially reduced.
Oil recovery approaches key resistance levels
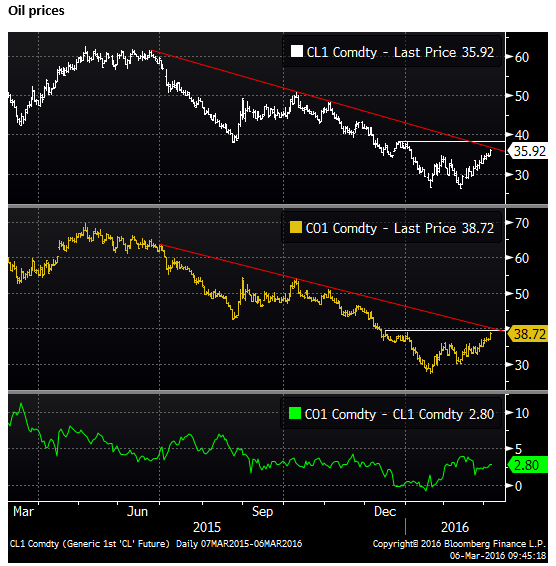
The oil price reached its lowest points on 20-Jan ($27.10 Brent) and 11 Feb ($26.05 WTI). Brent has rebounded to approach the peaks in December, and WTI has rebounded to a high since 5-Jan, just before it began its New-Year’s crash.
The intense bearishness in the oil market in the New-Year crash that extended into a volatile and choppy market through the first two weeks of February has now become more balanced after a steady and solid recovery over the last three weeks reversing the fall early in the year.
As the chart below suggests oil is now at a significant technical juncture, testing the down-trend line since mid-2015, and around the peaks in December. If it breaks these resistance levels the market may feel more confident that a long term bottom is in and see potential for a recovery towards $50. Already the more balanced mood in the oil market has spread to broader financial market confidence.
The bullish case for oil
An important positive development for oil has been agreement expected between the major global oil producers to freeze output at the January level. Comments from Russia and Saudi Arabia and a host of smaller producers suggest they will make this agreement at a meeting scheduled for 20-March.
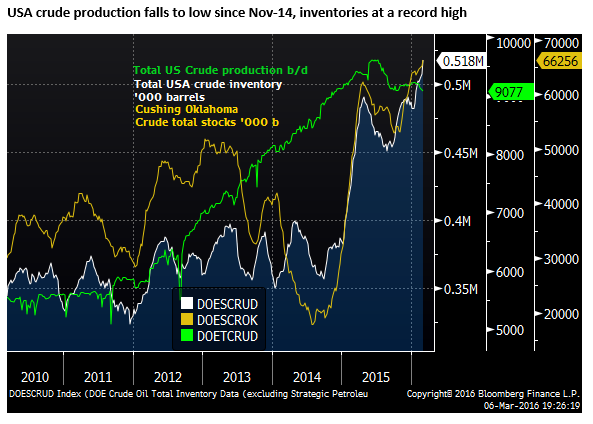
Perhaps the biggest swing producer that firstly contributed to the global oil glut by steadily increasing production between 2011 and mid-2015, the USA, now appears to be producing somewhat less. And its refiners have increased demand recently, suggesting US demand is rising in response to lower prices.
However, USA inventory has still been growing recently. A key concern of the market in the midst of the recent bearishness has been that global storage capacity was close to be used up.
The bearish case for oil
The bearish argument for the oil market is that even at the January levels of production, supply is still expected to outstrip demand for potentially the next couple of years or more. And there are sceptics that major oil producers will stick to their commitments to freeze output.
If oil prices rise too much, US oil producers could also quickly increase production. As such, there should be limits to how far oil prices can rebound for the foreseeable future.
It might be a stretch to see oil prices reach $50, and perhaps they will settle in a $30 to $50 range for some time, with a risk that they again slump if cooperation between oil producers falters and global growth and demand remains tepid.
If oil prices remain below $50 for the foreseeable future, then economic pressure will remain on large sections of the oil industry and investment in the sector is likely to remain low. While defaults may occur more slowly and economic down-turn in several energy producing countries may be less severe, we may still find below trend growth and generally increasing fiscal pressure and a need to pursue very easy monetary policies for the foreseeable future in these nations.
Natural Gas prices still at record lows
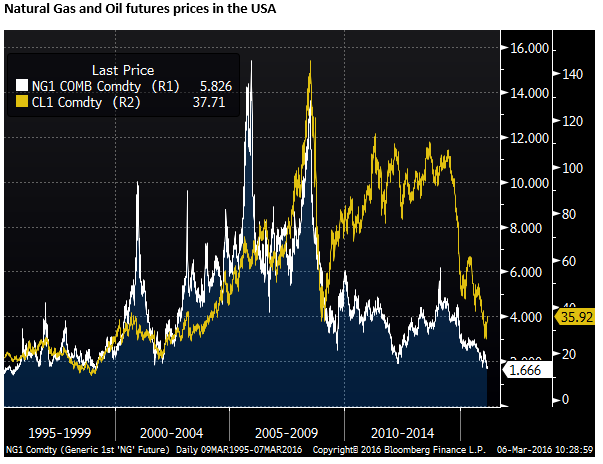
One energy price that is yet to pull-out of its bearish trend is natural gas in the USA. The USA is only just starting to export natural gas, so the price largely reflects North American supply and demand. NatGas has fallen to lows in 17 years. Gas prices depend on the weather, and the winter spike in heating demand is less than normal, putting downward pressure on gas prices in the USA.
Rig count indicates weak investment in the Energy sector
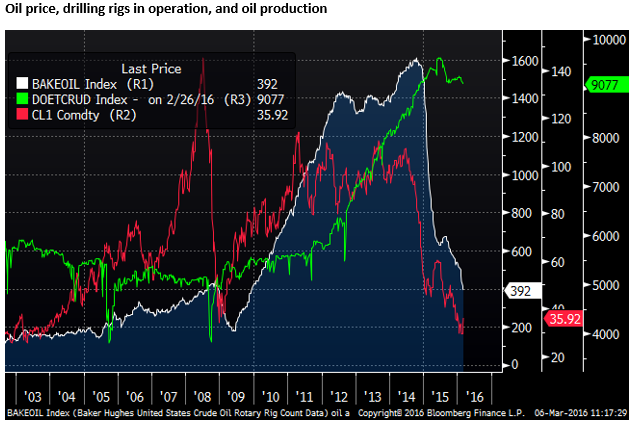
The sharp falls in both oil and gas prices have led to falls in the Baker Hughes count of USA rigs drilling for gas and oil (chart below). At the peaks, total rigs were above 2000, and specifically for oil at over 1600 in late-2014. Total rigs are now 489, around a record low, and specifically for oil at 392, a low since 2010, before the surge in production began.

Without being knowledgeable in the production process of oil and gas, it is evident that production can continue at a high level without drilling rigs being active. The rigs are presumably mostly involved in developing/investment in new wells, and once drilled, wells appear capable of producing without active rigs.
The number of rigs is therefore more an indication of the investment in new capacity, and they fell sharply once the market lost confidence in the longer term average price of oil. Once the well is sunk, so presumably are much of the production costs, and oil continues pumping at much lower prices.
Presumably it makes sense for oil producers to continue pumping oil or gas even if they are not covering their averages costs (including amortized investment costs). While operating at a loss they may struggle to meet debt payments, and even once they go bankrupt, liquidators are likely to insist they keep pumping. Financial distress in the sector is likely to limit finance available more generally.
The chart below shows the oil rig count, oil price and oil production. There is a substantial lag between the rig count and oil production, and even though the rig count has dropped back to historically low levels, oil production remains much higher, not far from its peak levels that occurred 9 months after the rig count peaked. We might expect a much more gradual decline in production that depends more on the life of existing oil wells than the price of oil.
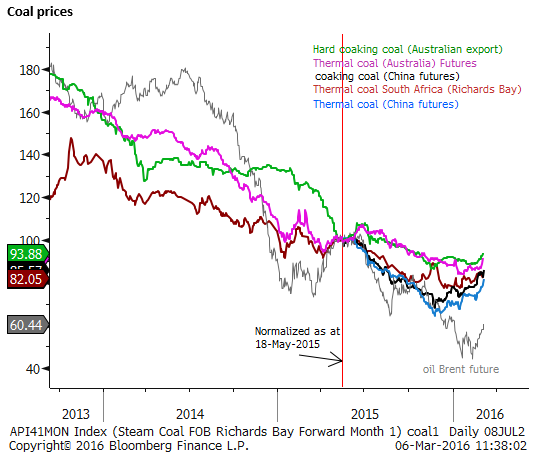
Coal prices rising, particularly in China
While the energy market has been focused on production and demand in the USA, and developments in OPEC and Russia, other commodity prices have also bounced sharply over recent weeks.
This may reflect the impact of confidence in the oil market allowing for improved confidence in global financial markets and in turn global growth. It may also in part reflect a weaker USD trend, and a lack of confidence in alternative currencies, lifting all real asset and commodity prices.
It may reflect more confidence in the growth outlook for China. Perhaps the market has reduced its fear of a hard-landing in the Chinese economy brought on by rapid capital outflow and possible CNY currency collapse. Chinese production of coal and iron ore has also reported to have been reduced.
The chart below shows various coal prices. Both Thermal (Electricity-generating) and coking (steel-making) coal futures prices in China have rebounded solidly in recent weeks in line with the rise in oil prices. Prices for these contracts in fact bottomed on 24-Nov, well before the low in Brent oil on 11-Feb.
Coal prices from other major exporters, Australia and South Africa bottomed somewhat later than in China, and have not yet rebounded as much, but they have picked up noticeably in the last week as oil prices and broader global risk appetite has improved. So far prices for Australian thermal and coking coal appear to have more stabilized than started a rising trend, but are both around the highs since Oct/Nov last year. Similarly for South African coal export prices.
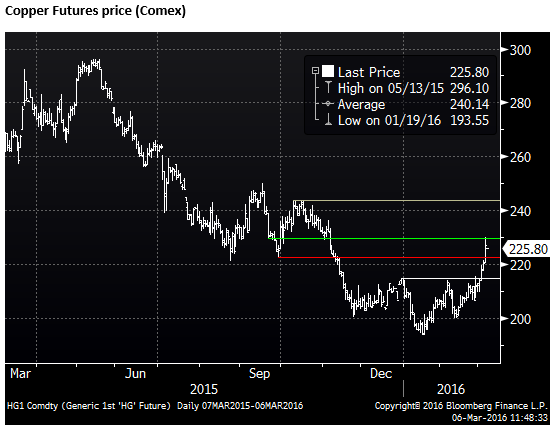
Copper prices up sharply
The price of copper, closely monitored as an indicator of the health and confidence in the global economy, has rebounded sharply in the last week, breaching previous peaks at 31-Dec and 4-Feb to rise to a high since 5-Nov.
Similar to oil, perhaps more so sitting above December highs, copper appears to have put in something of a base. Although, it now sits in the range it traded between July and November last year, and while it remains below the high side of this trading range (around 245 $/lb on Comex), the market is likely to doubt it has begun a new up-trend.
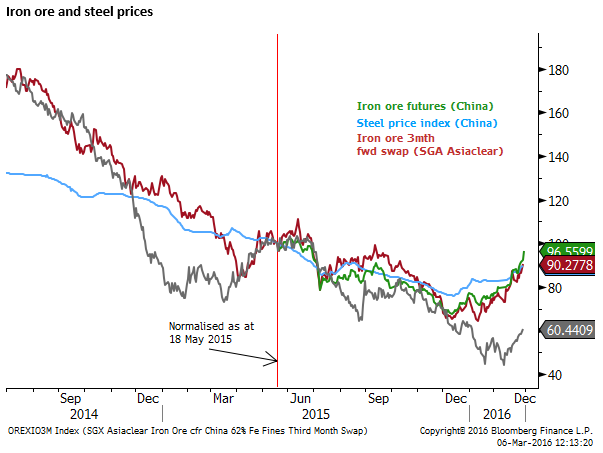
Steel and Iron Ore up sharply
Similarly to copper and oil, steel and iron ore prices have also rebounded solidly.
Steel and iron ore prices bottomed in China in mid-Nov, and iron ore swap prices in Singapore in mid-Dec (ahead of the low in oil prices and copper that have been more closely aligned). But certainly the solid rebounds in oil and copper in recent weeks have been associated with more rapid recovery in iron ore and steel prices.
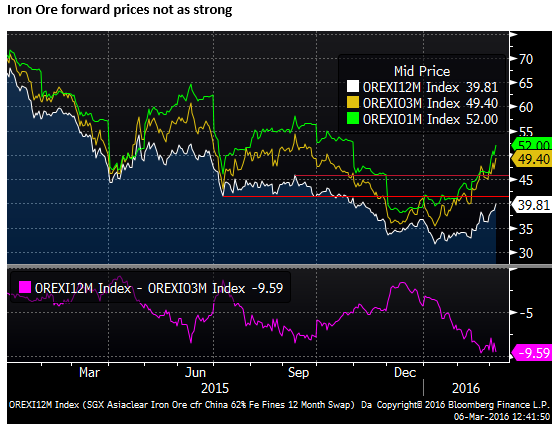
Like other industrial metals and oil, iron ore has shaken off its heavy winter bearish coat, but still remains in a longer run downtrend. Iron ore is still trading below its peaks in September which should act as significant resistance. The rally to date is also more pronounced in shorter dates, and the 12-month ahead contract is below the earlier months (backwardation), suggesting that the market fears the rebound is more short-term in nature. (The gap between the 1mth and 12mth contract is around its widest since Jan-2014). The oil price curve, in contrast remains upward sloping (contango) with the price 12 months ahead above the earlier contracts.
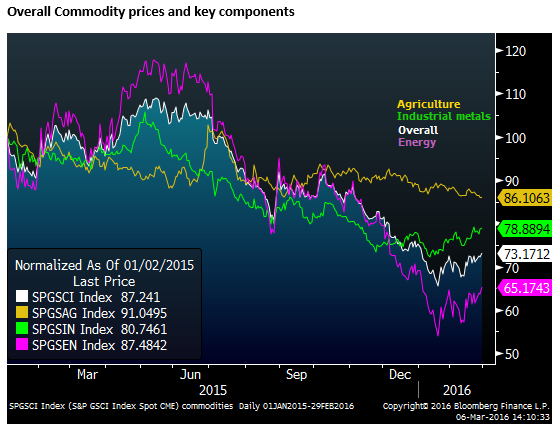
Overall commodity prices up, agriculture still soft
To gauge an overall view of commodity prices the chart below shows the S&P GSCI index aimed at providing a guide to general price movements and inflation in the world economy. Also shown are the components for Energy, Industrial metals and Agriculture.
While energy and metals have risen since lows early in the year, the agriculture index has continued to fall to new lows recently.
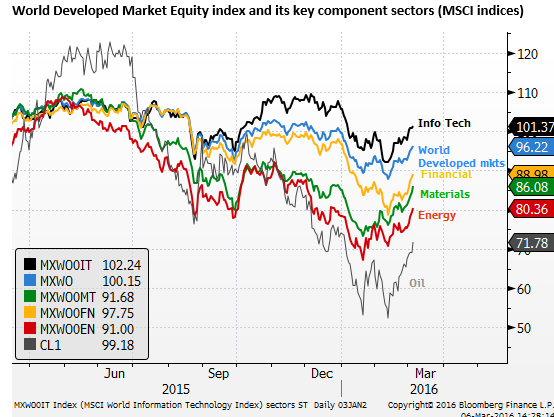
Equity markets rebound with oil, energy and materials outperform year-to-date
Equity markets became increasingly correlated with the price of oil this year, as the rapid fall in oil, volatility and recent recovery have driven global investor sentiment. All key sectors of the global equity market have rebounded with the price of oil since its secondary bottom on 11-Feb, which also marked the bottom of the overall global equity market.
This low point for equities was driven mainly by financial and IT equities, with the energy and materials sectors making their low points during the first low in oil made on 20-Jan.
Energy and Material sector equites have almost recovered all their losses for the year. Financials and the overall equity market are still down significantly on the year-to-date, but are at their highs since at least the first two weeks of the year.
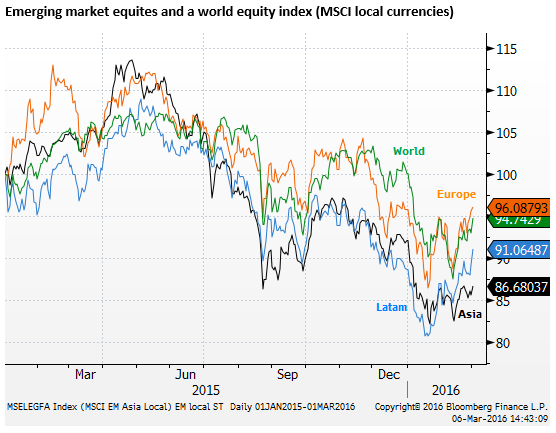
Emerging market equites out-perform developed markets
Emerging market equities have participated in the equity recovery. Latam and European emerging market equites have significantly out-performed developed markets, both up on the year-to-date. Asian equites have been more subdued.
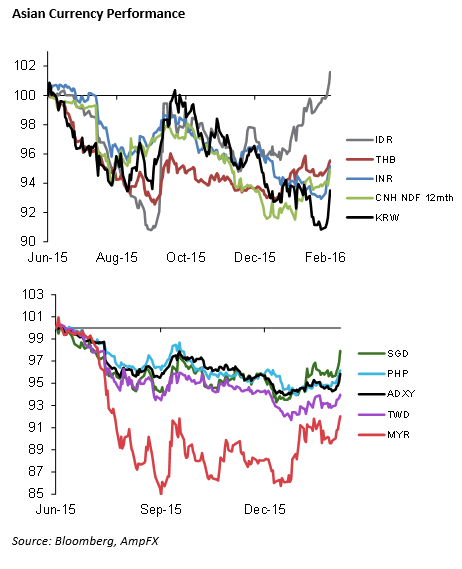
Sharp rebound in Emerging currencies
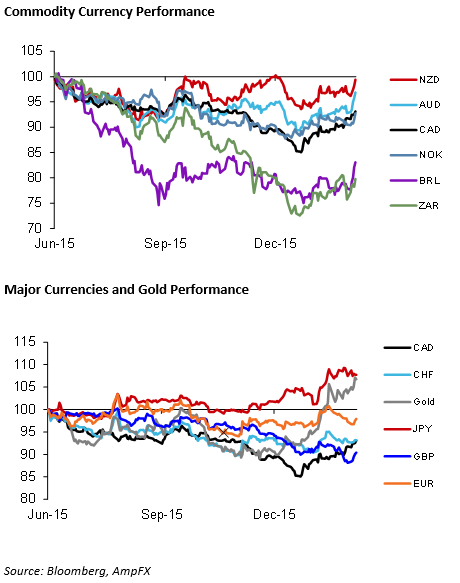
The last week was notable for a sharp rebound in emerging market currencies. BRL was the best performing currency up 7.1%, RUB was third up 4.2%, and ZAR was fifth up 3.4%.
KRW was the best Asian currency up 2.8%.
The AUD was the best performing G10/commodity currency up 3.9%, NZD was 2nd up 3.1%
The broad-sweep higher in emerging market currencies last week, leading the way against a broadly weaker USD, were consistent with the broad-based more rapid rally in equites and industrial commodities.
A number of EM and major currency energy producer currencies have followed the recovery pattern in oil. With either lows near the 20-Jan or 11-Feb lows in the price of oil (BRL, MXN, CAD, CLP, RUB, IDR, and MYR following this path).
The stronger more stable path for the CNH from just before the Chinese New Year break (6-15 Feb) helped impart a stronger tone on Asian and other emerging market currencies.

EM assets bottomed in January ahead of developed markets
Many emerging market currencies and equities that were beaten down significantly in the second half of last year in the context of global risk aversion found their lows on around 20-Jan, near the first low-point in oil prices, and have appeared more resilient than most developed market assets over the last month and a half.
Many developed market assets were hurt more by the weak financial sector that bottomed on 11-Feb, at the time of the second low point for oil. As noted earlier, even mining and energy stocks showed resilience to this second low point for oil prices.
The USD has been surprisingly weak this year
The USD has been relatively weak this year. Most emerging market currencies, particularly commodity producers, are well up on the year. The more telling fact is that the USD is down against the EUR and the JPY (significantly so against the JPY). This is despite a significant recovery in global risk appetite from its two low points on 20-Jan and 11-Feb.
Furthermore, JPY is stronger despite the BoJ introducing negative cash rates on 29-Jan (also an interim high point in oil between its two troughs this year). And at its first policy meeting this year on 21 Jan, the ECB almost promised to ease at its next meeting (this week).
The USD was particularly weak against the JPY and EUR in the second wave of the oil price decline, and associated fall in developed market financial equites, following the BoJ rate cut.
In the latest rebound phase in global markets and oil since 11-Feb, the USD has been relatively stable against the JPY and gained only modestly against the EUR.
The price of gold has trended consistently upwards this year, consistent with the notion that the USD has been relatively weak. It has gained during periods of risk aversion that prevailed through to 11-Feb. Gold’s rise was most rapid during the second phase of the oil price decline that coincided with particularly weak financials and developed markets. Gold dipped briefly early-on in the most recent recovery in oil prices and rebound in global equites, but it soon re-established its rising trend, even accelerating somewhat in recent days.
In the last week, with a rapid rise in virtually all assets and currencies (even EUR to some extent), and some acceleration in the gold rally, it appears that there has been something of a back-lash against the USD. This is despite a rebound in US yields.
Reasons for a weak USD
There were probably a several reasons why the USD has been weak:
The Fed appeared more dovish and the market was significantly downsizing the scope for further Fed rate hikes.
Secondly, Japan and the ECB adopted easier policy stances (in rhetoric or action). This may have contributed to weaker developed market financial equites on fear that deeper negative rates would undermine their profitability.
EM and commodity assets were already deeply beaten down since the second half of last year and the market was underweight these assets. The market was looking for an alternative for developed market assets and could see value in EM and commodity assets. The gold price rise was most rapid in the second phase of severe risk aversion between 29 Jan and 11 Feb, a sign the market was seeking haven from developed market assets and the USD.
Strong JPY contributing to broader weakening tone in the USD
One of the hardest to explain developments is the persistent strength on the JPY. After cutting rates and a broad-recovery in risk appetite, the JPY has remained around its highs for the year, and highs for some time. JPY is at a high against the EUR since the first month of the BoJ’s original Quantitative and Qualitative monetary Easing (QQE) in April 2013.
It appears that a sense of fatigue has set in after more than three years of Abenomics. For instance, Japanese pension funds may now be advanced in reallocating their assets towards foreign equities and bonds, lessening supply of JPY.
There has been a public and political backlash against the BoJ and Kuroda since he adopted the negative rate policy. He probably hoped that the JPY would weaken sharply, but in fact the opposite occurred.
He may have had some unfortunate timing since oil prices and financial sector equites fell sharply soon after this policy announcement, intensifying global risk aversion.
However, it may also be the case that the negative rate decision added to global uncertainty, setting up a game of competitive rate cuts with the ECB and weakening the outlook for financial equites.
The perverse currency market response to the rate cut added to the confusion in Japan and intensified the criticism of Kuroda. Part of that criticism was associated with the surprise tactics employed by Kuroda. In two previous occasions April-2013 and October 2014, surprise appeared to work significantly in his favour. But this time it back-fired.
Now the market fears the political capital of the BoJ Governor has been diminished and his options for further policy action diminished along with it. Cutting rates further now seems less likely after the first attempt failed to deliver the expected result.
Commentators believe Japan’s capacity to use FX intervention to weaken the JPY is also limited by political pressure from abroad.
The strength of the JPY itself may be partly responsible for the broader weaker trend in the USD. The price action this year in the JPY suggests that the safer bet at this stage is to fund a return to higher yielding assets out of the USD.
Market back to using USD to fund high yield carry trades
In the last few weeks since 11-Feb all asset markets, commodities and currencies have been strengthening (the exceptions being the USD, JPY and EUR). In this period of risk recovery the JPY has been surprisingly resilient little changed against the USD, and the EUR has weakened only a little (although even it recovered last week, despite the strong US payrolls). Gold has continued to rally despite the risk recovery, even accelerating in the last week.
The broad weakness in the USD, especially in the last two weeks during a recovery in US yields, stronger USA inflation data and a strong payrolls report is harder to understand.
It appears that the market was keen to get back into EM and commodity currencies because they were beaten down and better value, China appeared more stable, oil prices were recovering solidly, and developed market assets were on the nose after the financial sector asset dive and uncertainty over fallout from negative rate policy. As such they needed to sell something to fund this flow, and USD was a prime candidate.
Furthermore, the USD was relatively expensive after strong rises through 2014 and 2015 in anticipation of the December Fed rate hike.
The Fed started making dovish noises in response to global market uncertainty, weaker US activity indicators, and lower US and global inflation expectations. The market now presumes the Fed has taken a March rate hike off the table and is in wait-and-see mode.
The market may sense that in light of global growth uncertainty and lower inflation expectations, the Fed may in fact be willing to free-wheel on policy for longer even if actual USA inflation approaches its 2% target more quickly.
With the first rate hike out of the way in December, the market may be more focused on the pace of rate hikes and sees fewer over a drawn-out cycle.
The market may have switched back to some extent to a more genuine risk positive mode, willing to play carry trades in higher yielding EM and commodity currencies, seeing less US hikes over the cycle, and willing to buy into some higher yielding currencies even if the spread over the USD has narrowed somewhat.
The response to the payrolls figure was to push the USD down because the one component that was weaker than expected, the wages growth number, may allow Fed policy to remain easier in support of growth for longer, bullish for global assets and carry trades.
The markets may simply feel unsure over the direction of policy in the ECB and BoJ. Both countries are running bigger current account surpluses. This uncertainty may include fear than both central banks are running out of scope to further ease policy, and the market feels more assured over Fed policy direction.
USD weakness may not persist
This is not a particularly satisfying explanation for sustained weakness in the USD against the EUR and JPY. Both the ECB and Japan are likely to further ease policy, and have negative rates that should be substantial reasons to sell these currencies. If risk appetite is truly increasing then there is good reason to sell these currencies ahead of the USD.
Yields are still low and falling in Japan and Europe across their curve. It is hard to argue that their currencies will not resume a weaker trend, even against the USD, given enough time. This is especially true since US yields have risen over recent weeks widening the yield advantage of the USD over these currencies.
There is a case to be made that the USD is simply retracing somewhat from its strong run over recent years. The US economy is still better placed to establish sustainable growth over the medium term than most other economies, including EM. Policy divergence with the ECB and BoJ continues, and at some point the USD should start to strengthen again.
However, it is currently in a more bearish trend and it might be said that the onus is on the US economy to prove that its growth is sustainable and inflation is returning. For instance one poor US payrolls report might extend USD weakness for considerably longer.