The US dollar is not overvalued
It is evident that the market has grown tired of the divergence in monetary policies as a theme driving currencies. The USD has to a significant extent already built in a tightening cycle. The market has paid more attention recently to nuanced shifts away from further policy easing in Europe and some other countries. The USD has fallen despite two rate hikes since December, and reversed most of its ‘Trump bump.’ The market appears in a mood to be looking for a reversion to the mean in exchange rates. However, even though the USD is above its long-run average levels in real effective terms, its overvaluation is not excessive on broad indices. The USD yield advantage has risen to historically high levels, and against many currency pairs, the USD appears cheap relative to yield spreads. The Fed seemed to hike in response to stronger equities, narrower credit spreads and a weaker USD this year (easier financial conditions) rather than on any additional confidence in the outlook for US growth and inflation. The market is aware that the US administration and the Fed appear to prefer a weaker USD and this may be detracting from its performance, even as USD rates rise. At some point, the under-performance in the USD relative to its improved yield advantage should end. Perhaps it will take clearer evidence that inflation pressures in the US are picking up. It remains the case that the Fed’s rate outlook and the USD have built-in little prospect of fiscal stimulus, or a border tax, both which point to upside risk for the USD. The equity market continues to show strength, suggesting it is responding to evidence of stronger growth globally and domestically, and remains confident that tax cuts will be delivered. The USD and rates market appears more pessimistic on the economy and doubts Congress can deliver tax reform, and other growth-boosting policies. We acknowledge that the USD is struggling, but we are still biased to buy USD and will be looking for signs that it is breaking out of its rut. Our look at real effective exchange rates and yield spreads continues to suggest that the NZD is significantly over-valued.
The USD gives back Trump bump despite two more Fed rate hikes
The Fed has delivered what may be described as a dovish hike; a hike that resulted is a significant fall in US yields.
The principle reason is that the FOMC median forecasts for rate increases over the next three years (in their ‘dot-plot’) were unchanged from its December forecasts. And Yellen emphasized in her press conference that the decision to hike was “in line” with the “gradual” rate increase projected for “some time” and “does not represent a reassessment of the economic outlook or of the appropriate course for monetary policy.” In essence, Yellen dressed this rate hike in the clothes of no change in the policy path and outlook.
The chart below shows the movement in US 2-year rates and 10-year yields, and an index of the USD over the last year. One interesting fact is that the USD is below the levels prevailing before the Fed’s last two rate hikes (on 14 December and 15 March), even though US yields are significantly higher. This applies in particular to the 2-year swap rate that has risen from 1.39 to 1.65% (+26bp). Few other countries have seen their 2-year rates rise much, so this represents a significant boost in the USD yield advantage that has failed to boost the USD.
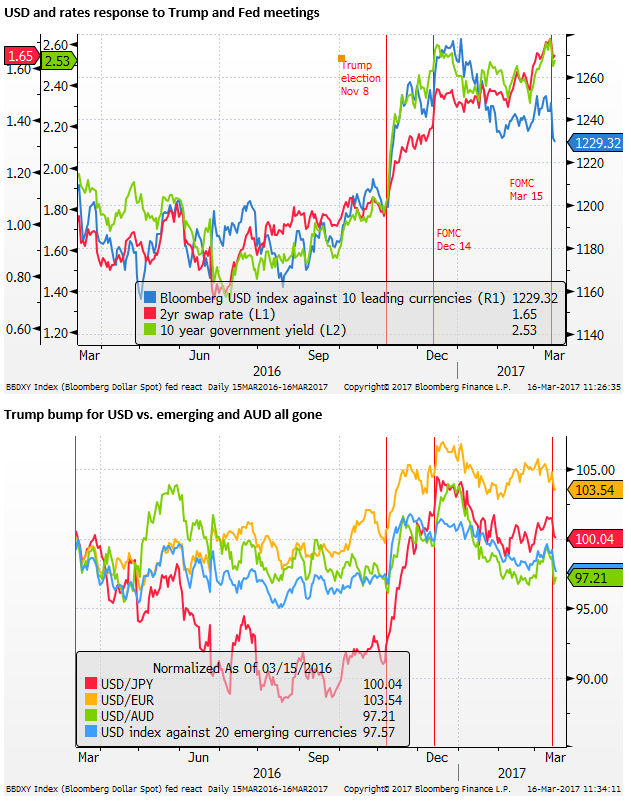
The 10-year yield is up by 6bp since the day before the Dec FOMC, but the Bloomberg USD index against ten leading currencies has fallen by 1.4% despite the two rate hikes. The decline in the USD is broad-based; it is lower against EUR, JPY, AUD and an index of 20 emerging market currencies.
The chart above does show that the USD index is above levels that prevailed before the election of Trump on 8 November. Since the election, US yields are more markedly higher. However, since the peak in the USD around the turn of the year, (also near the first peak in 10-year yields), the USD has retraced more than half of its gains since the Trump election.
Against the index of 20 emerging currencies, the USD has fully retraced its gains since the Trump election. Most of the strength in the USD since the election is against the JPY, and to some extend the EUR. The AUD is now little changed since the Trump election, and many emerging market currencies are significantly stronger.
The USD, on the whole, is struggling, failing to receive a Trump bump and faltering even as the Fed has sped up its rate hikes.
It appears to be the case that the market has built-in much of the anticipated USA rate tightening cycle, and has in its sights the eventual policy normalization elsewhere in the world, no matter if that still appears some time away.
Long term charts show significant under-performance in USD relative to its higher yield advantage
We have noted that the USD seems to be significantly under-performing 2-year rate spreads with other currencies, even on a long-term scale. The Fed may still be in the early stages of a tightening cycle, but the rate spread in favor of the USD is already near long term historical highs, because most countries around the world lowered their rates to historic lows in recent years are yet to begin policy tightening
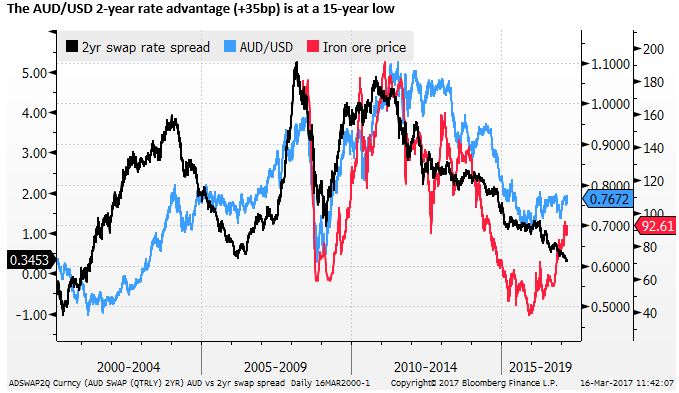
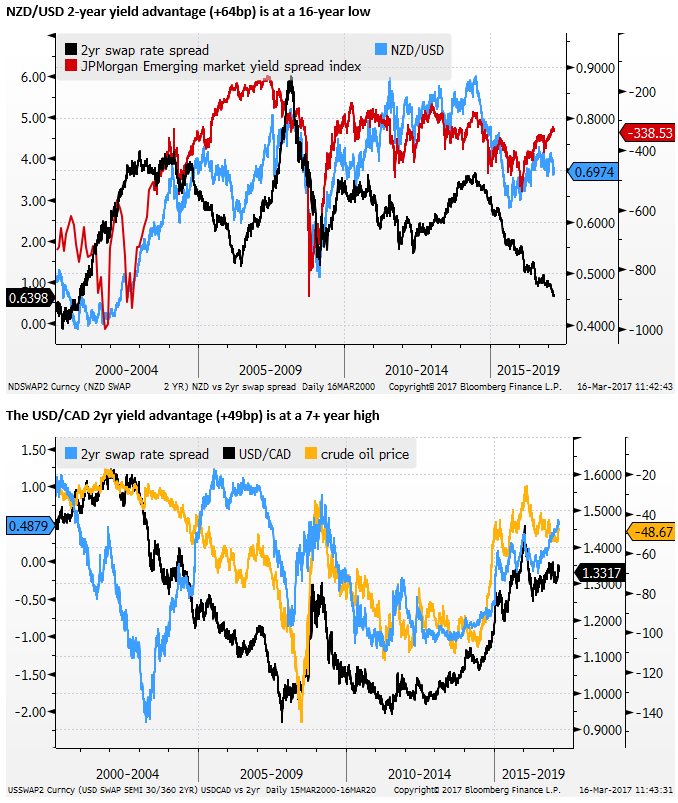
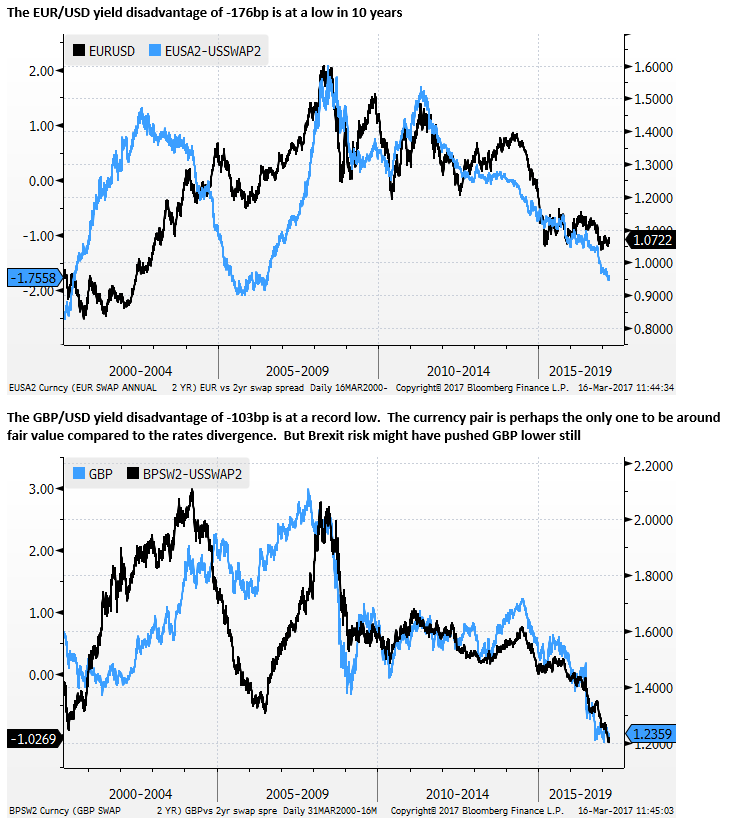
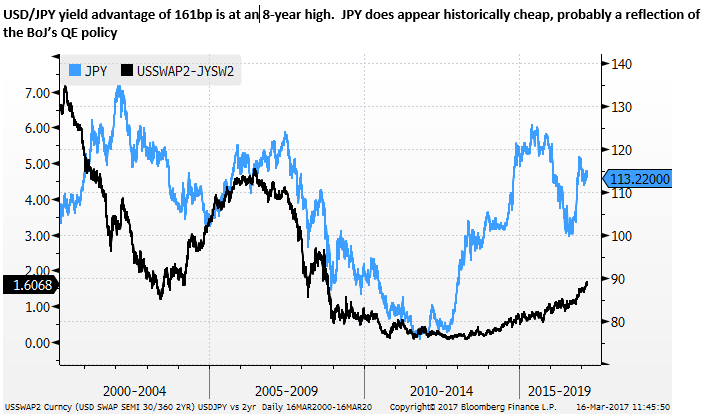
On the whole, the charts above show that the USD is diverging from its improving yield advantage over the last year or so, more so in recent months. And this divergence appears to suggest that the USD is relatively cheap on a long-term comparison relative to its yield advantage.
USD high but not very expensive on broad real effective measures
Many commentators have noted that the USD is historically strong, in that it is above its long-run average real levels, and this represents a threat to growth in the US economy. The Fed itself raised this concern several times in the minutes of its 31 Jan/1 Feb policy meeting early this year. The fact that the USD has fallen since January may have alleviated these concerns somewhat; contributing to the fed’s decision to hike its policy rate this week (using a window of easier market conditions to take one more gradual step towards normal policy).
There is a wide-spread perception that the USD is strong and dampening manufacturing activity and business investment in the USA. The Fed did appear to delay policy tightening in recent years due to relative strength in the USD. The US economy lost momentum in 2015 and 2016 after the sharp rally in the USD in 2014.
Nevertheless, the US economy has continued to maintain steady employment growth and falling unemployment over this period. The strength of the USD appears to have had less of a dampening impact in the last three to six months.
In any case, it appears that investors are looking at the USD as expensive, as having priced in a gradual tightening cycle, and is now in a mind to anticipate some mean reversion in the USD towards its long-run average.
Some in this frame of mind may continue to have doubts about the underlying strength of the US economy, and worry that its slow and prolonged recovery period over the last eight years since the Great Recession are indicative of deeper problems. The Fed itself continues to promote the idea of a lower new normal for real interest rates. Notwithstanding the fact that it is now close to its mandate for 2% inflation and full employment, it appears to lack confidence that a US recovery could withstand more normal policy settings.
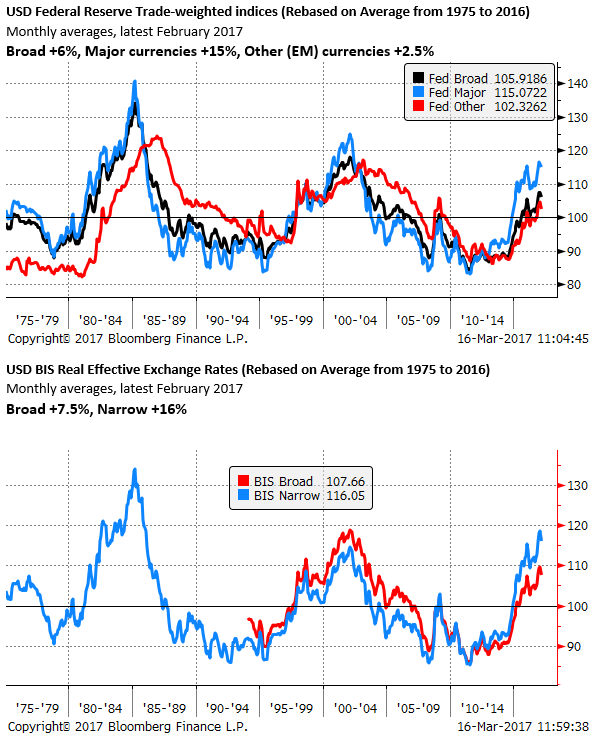
The charts below show the BIS Narrow Real Effective Exchange Rate Indices since 1975 (40 odd years), rebased on the average over this period. In February, the USD was around 16% above its long-run average, above its peak in 2002, set in the aftermath of the dot-com bubble, at its highest level since 1986, not long after the Plaza accord.
Since the early 1980s, the USD has tended to stay in cycles that end when it gets towards 15% above or below its average, and so it now seems excessively expensive by this metric.
The charts also show the results for several other currencies. The other major currencies are undervalued, especially JPY (-15.5%) and GBP (-16%), EUR is modestly undervalued (-3.5%). NZD is significantly overvalued (+24%), AUD is also overvalued (+14%). CAD is modestly undervalued (-7%), Mexico is significantly undervalued (-23%) and Korea is a bit expensive (+6%).
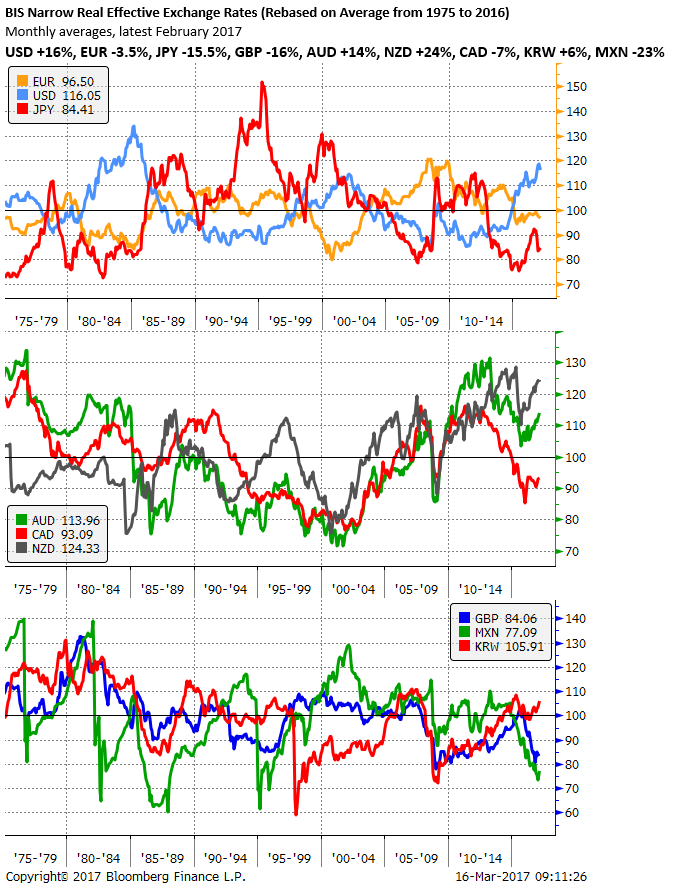
This narrow BIS series is narrow in the sense that includes a relatively small group of currencies (26 countries and 16 of these are European). It does not include several large emerging currencies, including China, which is the largest trading partner for many countries, including the USA. This series illustrates more so that the USD is historically expensive against other major currencies, especially JPY and GBP.
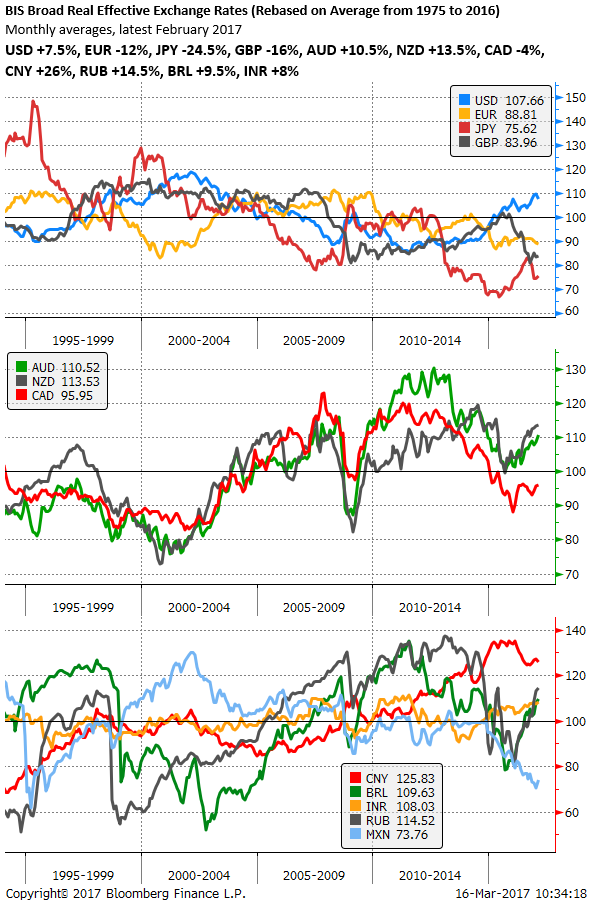
The BIS also produce a Broad Real Effective Exchange Rate series since 1994. This series that includes 61 countries suggests that the USD is not as overvalued. Unlike the narrow series, the USD is not as high as it was in the aftermath of the Dot-com bubble; in fact, it is much lower. At its peak in 2002, the USD was 19% above its average since 1994; in February this year, it was only 7.5% above.
The charts below show the results for a range of currencies. It again illustrates that other major currencies are significantly undervalued. The JPY (-24.4%), GBP (-16%) and EUR (-11%) are significantly below their average since 1994. The NZD is still quite expensive at 13.5% above average, as is the AUD (+10.5%), while CAD is somewhat cheap (-4%).
Large emerging countries’ currencies are generally above their average over this period. This might be consistent with their emerging status; their currencies appreciating as their economies develop. Remembering that these charts only show the position of these currencies compared to their average over the period since 1994. In absolute terms, these emerging currencies may still have significantly less purchasing power than developed countries’ currencies.
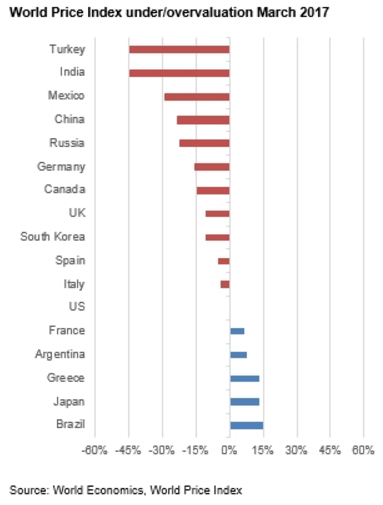
In this sense, their currencies may appear cheap even though they are above their average since 1994. According to World Economics World Price Index, Indian, Chinese and Russian currencies still have significantly less purchasing power than the USD, and thus may appear cheap. However, it finds the BRL has significantly more purchasing power than the USD, and thus is outright more expensive. (Further ahead we have added a chart of the World Economics measure of purchasing power).
Returning to the BIS Broad Real Exchange Rate series, CNY is 26% above its average since 1994, RUB is 14.5% above, BRL is 9.5% above, and INR is 8% above.
The BIS narrow series gives a significantly different picture of the US exchange rate than the broad series. The former suggests it is excessively overvalued; the later suggests it is modestly expensive. The difference, for the most part, reflects the former being mostly influenced by relatively cheap other major currencies; indicative of the negative rate, QE policies in Japan and the Eurozone, and Brexit combined with near-zero rates and a recent further QE in the UK.
The same narrow series suggests that the NZD and AUD are quite expensive, two currencies that have never implemented QE policies and retain above zero rates, albeit at their record lows. The NZD is higher than the USD, the AUD somewhat less so since it fell from record levels in 2013.
Once a larger set of currencies is included into the mix, the USD no longer is so historically expensive. A good deal of this difference will relate to the significant appreciation of the CNY in real terms in the last decade. Since China is the largest US trade partner, this will account for much of the difference between the BIS broad and narrow USD real effective exchange rate indices.
This China impact on the US real effective exchange rate is offset to a significant extent by the sharp fall in the Mexican peso in the last two years. Along with Canada, Mexico is in the top three US trading partners. However, both CAD and MXN are in the narrow and broad BIS series and their impact is not a source of difference between the two.
A look at the Fed’s own real effective exchange rates (they call trade-weighted indices) reveals a similar story. The Fed’s TWI includes a measure against Major currencies, Other Important currencies (i.e. emerging trading partner currencies), and a Broad index. Again, the over-valuation of the USD is mainly apparent in the major currency index at 15% above its average since 1975. However, unlike the BIS narrow index, the Fed’s TWI major index is not above its Dot-com peak.
The Fed TWI broad index which covers both the major and other currencies is much more modestly overvalued at 6% above its long-run average, far below the Dotcom peak. The TWI other (i.e. emerging market currencies) is only 2.5% above average.
To summarize, the impression of many that the USD is excessively expensive is over-blown. The USD is not so much expensive, it is more that the JPY, GBP and EUR are cheap. The MXN is also quite cheap tending to push up the USD real effective rate. However, against broad indices of US trading partners, the USD is only modestly expensive compared to its long-run average, it is far below its previous peaks before the Plaza accord and the aftermath of the Dot-com bubble, well within its normal range.
Absolute vs. the change in purchasing power
As mentioned earlier, the charts above show the movement in real effective rates around their long-run average. It does not provide a comparison of absolute purchasing power of these currencies. Emerging market currencies often have less purchasing power, even if that purchasing power has increased as they have become more developed.
The CNY may have appreciated in the last decade in real terms, such that it buys more USD, and with those dollars, it can buy more goods and services in the USA than it did ten years ago. But one CNY converted to USD will buy less rice in the USA than one CNY can buy in China. In other words, the general price level (adjusted for exchange rates) is lower in China than it is in the USA. The lower price level would tend to make China a cheaper place to manufacture goods than the USA, but it is not as cheap as it was ten years ago.
The chart below is an estimate of the purchasing power of currencies relative to the USD (relative price levels adjusted for exchange rates) from World Economics.
World Economics do not provide a measure of EUR as a whole, but breaks it down for several individual Eurozone countries. There are evidently different price levels across Europe. France and Greece apparently have a much higher general price level than Germany. As such, Germany appears to be a relatively cheap place to live and do business compared to France. One EUR buys more in Germany than it does in France. Germany is thus a relatively cheap place to manufacture goods, helping explain why it is the export and growth engine in the region.