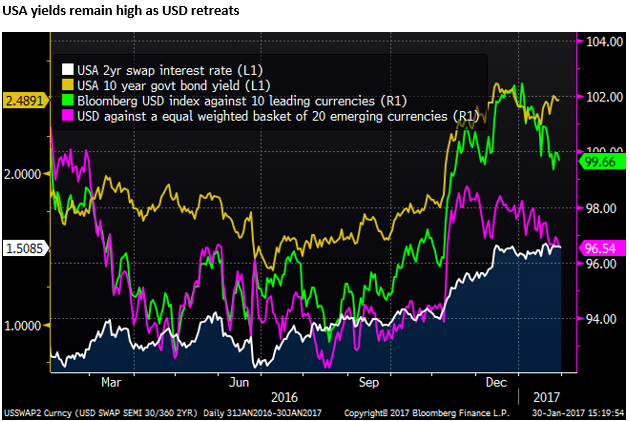
US yields remain high as USD retreats, NZ inflation accelerating as Australia’s stalls
Trump theatrics aside, USA economic data remains on a solid footing, and inflation pressure is firming to near the Fed’s target. USA interest rates and yields have been relatively stable near their cyclical highs since the Fed sounded less dovish at their December policy meeting. As such, higher yields are providing underlying support for the USD despite its significant retreat so far this year. Risk aversion from Trump’s ‘alt-right’ policy direction may pose a threat to global asset markets, but economic growth and inflation indicators have improved in most parts of the world since mid-2016. Higher global bond yields should tend to support USD/JPY. In the near term, frenetic policy announcements in the USA and a global backlash is generating increased economic uncertainty, tending to cap USD/JPY. New Zealand inflation data appears to be accelerating as Australian inflation momentum in recent quarters remains at long-term lows.
New Zealand inflation rising
New Zealand inflation data released on Thursday last week showed clearer acceleration across core measures. The economy has been operating above its long-run potential for most of the last several years and inflation may now be starting to respond.
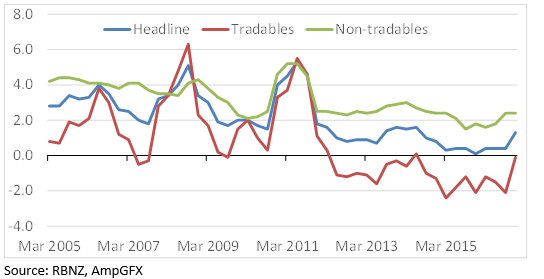
Headline inflation rose to 1.3%y/y in Q4, the first time back into the 1 to 3% RBNZ target range since Q2-2014, driven by a rebound in tradables inflation (-0.1%y/y), reflecting higher fuel prices, although still down from a year earlier.
The more core-orientated non-tradables inflation was steady at 2.4%y/y, equaling the highs since Q1-2015. The housing sector continues to boost domestic inflation pressure. Housing and utilities sector prices rose 3.3%y/y in Q4, remaining around this rate since Q2, a high since Q3-2014.
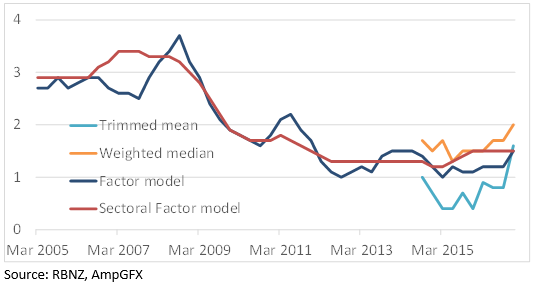
The trimmed mean rose sharply from 0.8%y/y in Q3 to 1.6%y/y in Q4. The weighted median rose from 1.7%y/y to 2.0%y/y in Q4. The RBNZ’s “factor model” increased from 1.2%y/y to 1.5%y/y, while its most stable measure of underlying inflation, the “sectoral factor model”, was steady at 1.5%y/y. As such, all underlying measures are now fairly comfortably inside the 1 to 3% target range, although still below the 2% target level.
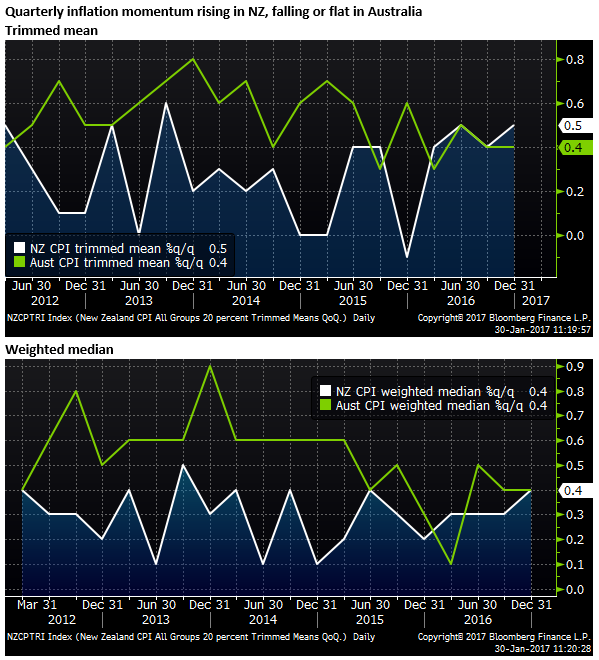
The New Zealand inflation data contrasted with the Australian data in Q4 (released last Wednesday), with the later showing underlying inflation remaining at its low (below target) with flat to falling momentum in recent quarters.
The relatively stronger CPI inflation report, and a range of other indicators consistent with stronger economic growth in New Zealand than Australia, has contributed to some recent further widening in the 2-year interest rate spread in favor of the NZD.
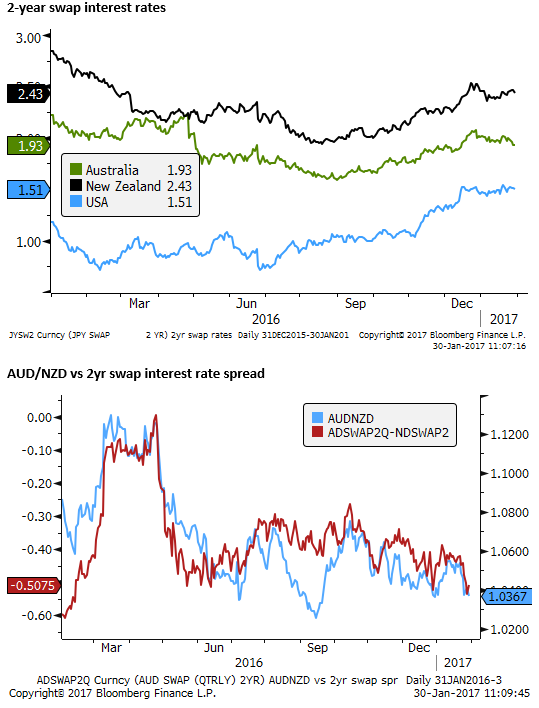
New Zealand Q4 employment data is due on Wednesday, and the risk is that it may reveal inflationary pressure from a tightening labor market. As such, we would not discount the possibility to of AUD/NZD pushing through its lows in recent months.
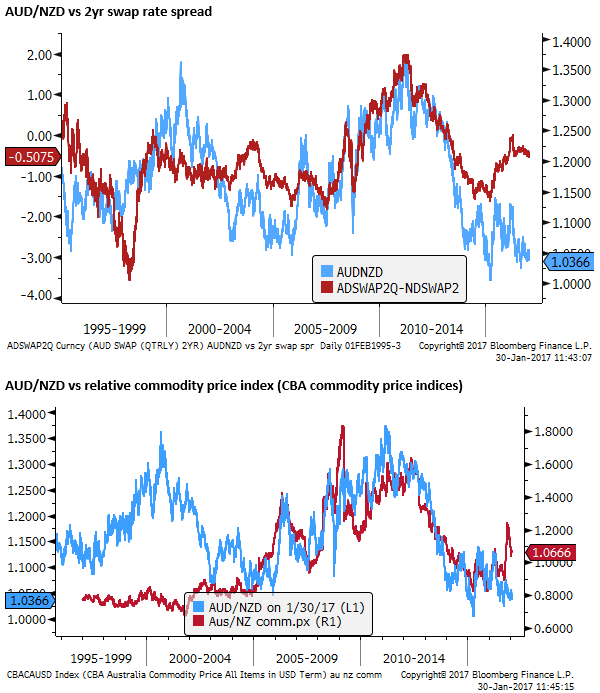
However, the AUD/NZD appears relatively cheap on a longer term comparison of relative interest rates and commodity prices; as charts below illustrate.
Solid USA economic momentum
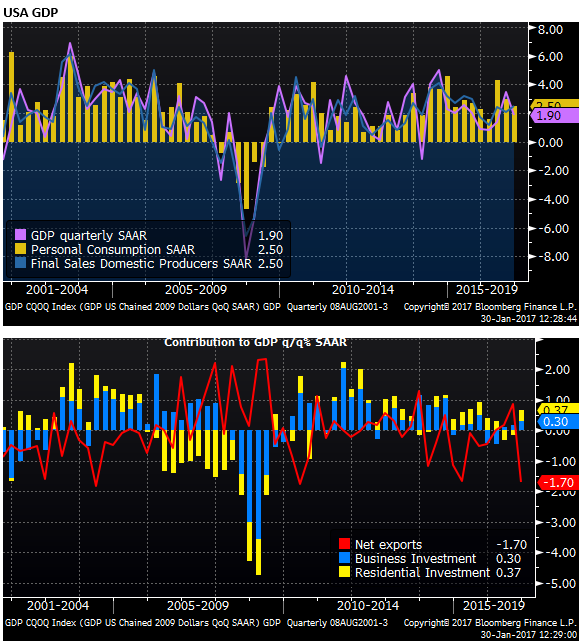
In the Q4 GDP report on Friday last week, household consumption spending rose 2.5%q/q SAAR in Q4. Business investment and residential investment contributed 0.3% and 0.4% respectively to quarterly growth
The headline Q4 GDP figure (+1.9%q/q SAAR) was dragged down by a -1.7% contraction in net exports, offset to some extent by a +1.0% contribution from the change in inventories. Excluding these two items, real final domestic demand rose 2.5%q/q SAAR
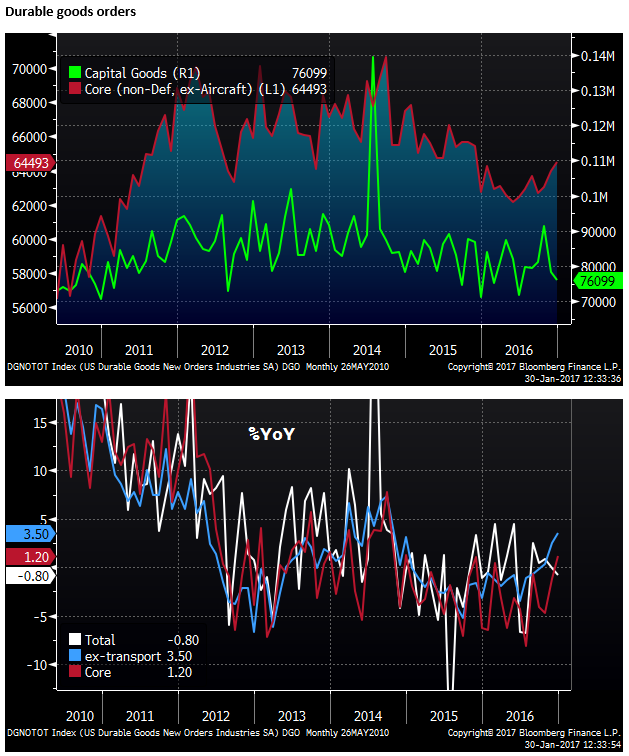
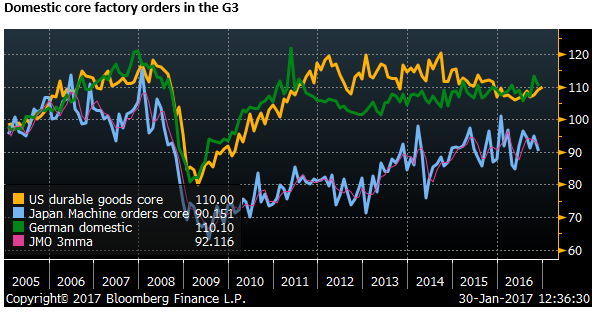
Durable goods orders are starting to show more consistent improvement for underlying core capital goods orders, up 3.8% in December from the low in May, up 1.2%y/y.
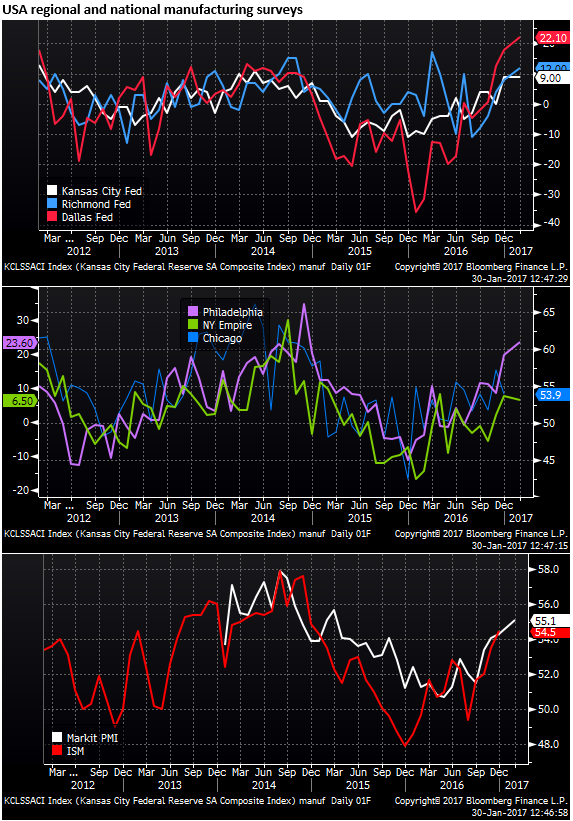
The Dallas Fed manufacturing index surged to a high since 2010, illustrating that the recovery in the energy sector in the USA since around mid-2016 is aiding the broader economy
The Fed’s preferred underlying inflation measure PCE excluding food and energy was reported as expected at 1.7%.
The Dallas Fed that produces a PCE trimmed mean stated that it rose 1.8% annualized over one, six and 12 months. These core measures are not far below the Fed’s 2% target.
The core measures from the CPI, including the weighted median and trimmed mean calculated by the Cleveland Fed, are all above 2.0%.

The solid path for USA economic growth and firming inflation indicators are keeping upward pressure on USA yields and interest rate expectations. These have been relatively stable since the Fed sounded less dovish at its December policy meeting, but they are still tending to firm, providing underlying support for the USD, even as it retreats this year.