USA breaking away from the low global inflation mind-set
The recovery in oil prices since Jan/Feb may help stabilize and even lift inflation expectations potentially from around July and more so from November through to early next year, provided oil prices remain at least stable. We have already seen some effect in pushing up headline inflation and long term inflation expectations in the USA.
The impact of higher oil prices recently on inflation outcomes and expectations in the Eurozone and Japan is hard to see and may be delayed particularly in Japan due to the recent sharp appreciation of the JPY.
Wage growth in the USA also stands out from its peers, it has established a rising trend and with lower productivity growth may already be consistent with inflation at or above the Fed’s 2% target.
Wage Inflation was perky in the UK last year, but has slowed to modest levels. Labor costs are sticky in the Eurozone, but are still trending down and are lower than desired. Labor costs have risen modestly in Japan in recent years, but the latest spring wage negotiations suggest progress on wage growth may stall well below desired levels. Australian wage growth is at record lows and is also dragging down the inflation outlook.
The outlook for inflation in the USA appears significantly more advanced than that for other major economies and is consistent with the Fed raising rates again soon. Actual Inflation and expectations in the USA may continue to build pressure for monetary policy divergence as the year progresses.
The low inflation mindset
Central bankers globally are battling low inflationary impulses and expectations, and this has tended to drive down global interest rates and yields to record lows. A fear in the market is that central banks, particularly in Japan and the Eurozone, are running out of ammunition to further ease monetary policy and may be losing the battle to push inflation up to their 2% targets.
In Australia and New Zealand where interest rates have been pushed to record lows, the market fears that further cutting rates may have limited impact on inflation and may exacerbate financial stability risks with already high and record levels of household debt to income.
These concerns may be pushing down inflation expectations making the task harder to achieve inflation over the longer term.
Market-based measures of long run inflation expectations
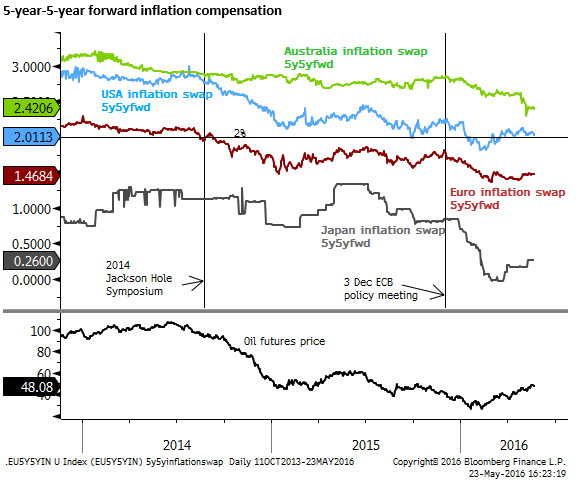
The chart below shows market based inflation compensation from 5 year forward to 10 year forward in the inflation swap market. This is the measure of long term inflation expectations that ECB President Draghi worryingly highlighted had fallen below the ECB’s 2% inflation target in a speech at the Fed’s Jackson Hole central bank symposium in 2014. Now at 1.5% in the Eurozone, the ECB by this measure, has failed to lift inflation expectations that have continued to trend down over the last few years.
Also shown is the oil price. Both the ECB and Japan further eased policy in 2014/2015 after the sharp fall in oil prices. They both feared second-round effects on inflation, such as through expectations and wage setting behavior that could turn temporary falls in headline inflation into longer lasting impacts.
Oil prices, inflation expectations and central bank policy responses
The ECB eased policy further in late 2015 and early 2016, citing again in part the further fall in oil prices. They noted that there appeared to be some correlation between market-based measures of long term inflation expectations and oil prices to help justify further policy easing.
Theoretically there should not necessarily be a correlation between long term inflation expectations, such as the 5-year to 10-year forward inflation compensation shown in the chart above, and oil. The effects of a one-time drop in oil prices should have a temporary influence on inflation, provided there are few second round effects. In a rational world such second round effects should not really exist. Furthermore, if central banks respond to lower oil prices by easing policy they may even exacerbate inflation by potentially boosting momentum in the economy in a year’s time after the temporary inflation shock has passed.
However, since inflation was already considered to be too low and falling, both the ECB and BoJ saw little risk in further expanding monetary policy in 2014/2015 in response the fall in oil prices. If these actions had boosted inflation more than expected, they would probably have been quite happy.
The ECB also attempted to rationalize the influence of oil prices on longer term inflation expectations by suggesting that the fall in oil price had occurred over a prolonged period (longer than a year) and people had become accustomed to seeing persistently falling oil prices. This may have filtered into expectations beyond the short term and thus contributed to second round and longer-lasting effects.
Whether there is an actual relationship between oil and long term inflation expectations or their correlation is just a coincidence is debatable. It may simply be the case that unrelated deflationary forces in both Europe and Japan have been exerted over recent years.
With excess capacity, aging demographics, structural and social rigidities, disinflation pressure was strong regardless of the fall in oil prices. However, in such an environment short term disinflation pressure from lower oil prices might be more problematic and more permanently delay the recovery in inflation. This possibility was expressed by the BoJ in late 2014, justifying its further policy easing.
USA showing some recent relative improvement in inflation expectations
As the chart above shows, market-based long term inflation expectations have trended lower in the USA, Eurozone and Japan over recent years. However, they have lifted a little in the USA this year. Euro inflation expectations have stabilized since around February, but only after falling to new lows.
Japanese long term inflation expectations fell much more sharply in the first few months of the year, and are considerably lower than those in Europe, suggesting that the BoJ is further behind the curve in achieving sustainable inflation near 2%.
One interesting point is that the recent recovery in oil prices since Jan/Feb lows this year has done little to improve inflation expectations in Europe or Japan. It does appear to have helped lift US inflation expectations modestly, which by this measure are somewhat above 2% again, suggesting that the USA is closer to its mandate for achieving sustainable inflation around 2%.
The chart also shows that long term inflation expectations have fallen sharply in Australia after the much lower than expected headline and core inflation readings in Q1 that resulted in the RBA significantly lowering its three-year inflation forecasts and cutting interest rates in May.
The chart below shows survey data on US inflation expectations. The outcomes are mixed. The University of Michigan 5-year to 10-year ahead expectation was 2.6% in May, around recent lows that have existed over the last year; the record lows in this long run series. The New York Federal Reserve 3-year ahead series that NY Fed President Dudley said he was more focused on, recovered from 2.5% in March to 2.8% in April, a more encouraging signal.
However, in both cases, the Fed would like to see some more consistent increases or at least more prolonged stability. It can at least take heart that both series are still above the Fed’s 2% target.

Oil price turn around should soon boost headline inflation
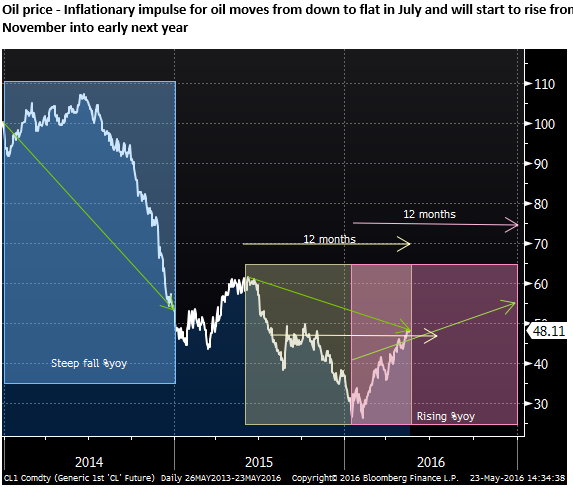
Looking ahead, we might consider whether the market has become too bearish, and locked into a mood of disinflation. The largest fall in oil prices is now more than year past and oil prices may have put in a long-term bottom earlier this year. As such, the direct inflationary impulse from oil prices has started to stabilize and should soon turn mildly positive.
The chart below shows the year-ended change in energy prices and the US headline CPI.
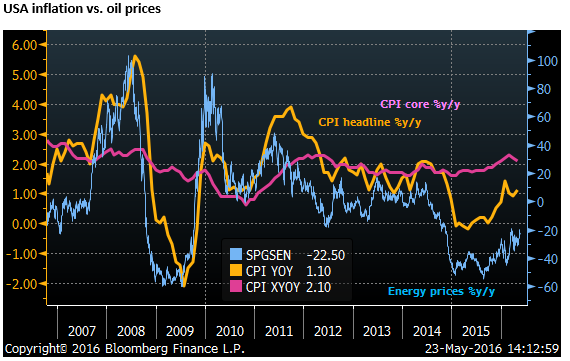
US headline inflation has been significantly influenced by lower oil prices, falling sharply on year-ended measures around the end of 2014 and early 2015.
Headline inflation remained near zero through much of 2015, but started to rise in late-2015. In the US, it rose from around 0% in Oct-2015 to around 1%y/y in early 2016, following closely the flattening out in oil price falls from a year earlier.
1% headline inflation is still well below the target 2%, but core inflation in the US, as measured by the CPI is above 2%.
Looking into the coming months, if the oil price remain stable, the change in oil prices from a year earlier will continue to rise. Oil prices have risen from their lows in Jan/Feb, and from around July this year, they will be around flat from a year earlier. As such in July, we should expect a solid uptick in headline inflation measured from a year earlier to be around the same as core inflation.
Furthermore from November into early next year, the inflationary impulse from oil prices may turn positive, tending to push year-ended headline inflation above core measures (provided oil prices remain relatively stable).
USA headline inflation rising more than others
The chart below shows headline CPI inflation %y/y for major and dollar bloc countries. While USA headline inflation has lifted recently, in-line with the flattening out in the decline in oil prices from a year earlier, the same is not apparent in Europe and Japan. UK headline inflation has lifted a bit, but less than in the USA.
Canadian headline inflation has also risen, although it remains low in New Zealand and Australia
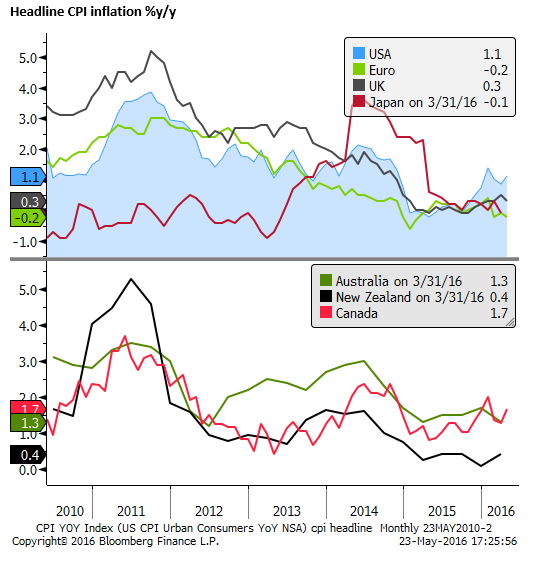
This delayed and limited response to the recent flattening out in the oil price in Europe, Japan, Australia and New Zealand on their headline inflation may also account for some of the lack of recovery in longer term market-based inflation expectations. And outright fall in longer term expectations in Australia.
New Zealand has also been battling with falling surveys on inflation expectations across the spectrum, including longer term surveys.
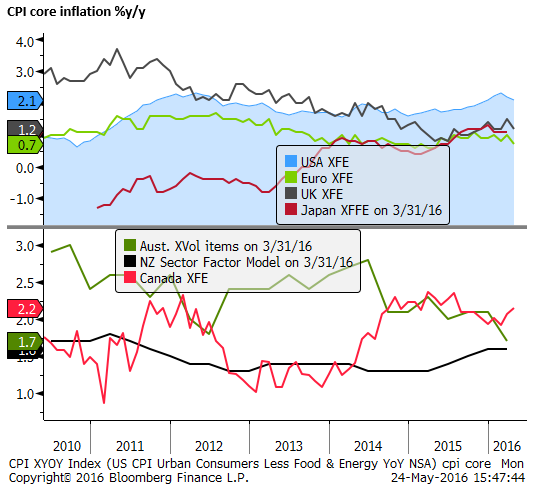
The chart below shows core measures of inflation for the major and dollar bloc countries.
Recent exchange rate appreciation weakening Japan’s inflation outlook
For US inflation, the link between commodity prices and inflation is clearer, since commodity prices are measured in US dollars. For other countries, the exchange rate plays a bigger role, since this determines the local price effect of commodity prices on their inflation.
The exchange rate will of course affect the import prices of all goods and services not just commodity prices and will tend to have a more lagged effect on inflation than changes in commodity prices. The recent sharp appreciation of the JPY for instance might be expected to weaken inflation expectations and may also delay and negate to some extent the direct inflationary impact of higher oil prices.
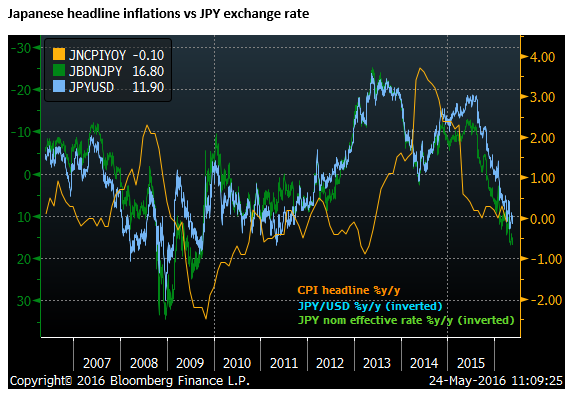
The chart below shows Japanese head-line inflation compared to the year-ended change in the JPY exchange rate (inverted) against the USD and on a trade weighted basis (JPMorgan effective nominal index).
The trade-weighted JPY has appreciated by 16.8%y/y and 11.9%y/y against the USD. This might be expected to have a significant dampening impact on Japanese headline inflation and inflation expectations over the coming year or two, posing significant problems for the BoJ in achieving its 2% inflation target.
The earlier depreciation of the JPY, which reached a peak annual decline of over 20% from May to Dec 2013, and a secondary peak decline of near 20% from May to July 2015, my still be exerting inflationary pressure. But at least this second round of depreciation will begin to be negated by the recent rapid appreciation.
Eurozone inflation failed to respond to a weaker EUR
The chart below shows the same data for the Euro. The sharp depreciation of the EUR of about 15% in annual terms at its peak in around Mar/April last year may have helped lift inflation and expectations over the last year, however the impact is hard to see and was probably offset by the big fall in oil prices at the same time.
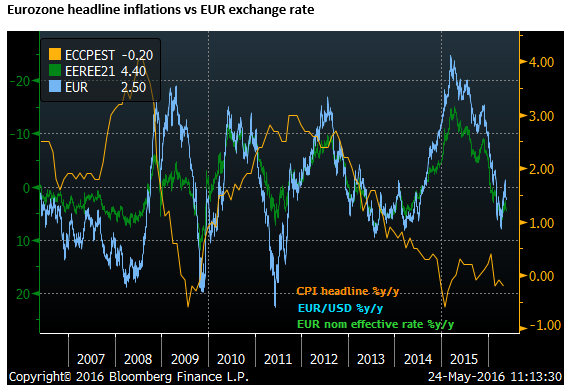
Some of the lagged inflationary impact of a weaker exchange rate may still be coming through, but the EUR has been stable now for more than a year, even a bit stronger, so the inflationary influence of a weaker EUR is likely to fade.
Nevertheless, with a relatively stable EUR and flattening decline in oil prices, soon to potentially be a rising oil price from a year earlier, might be expected to help boost European inflation and inflation expectations over the year ahead.
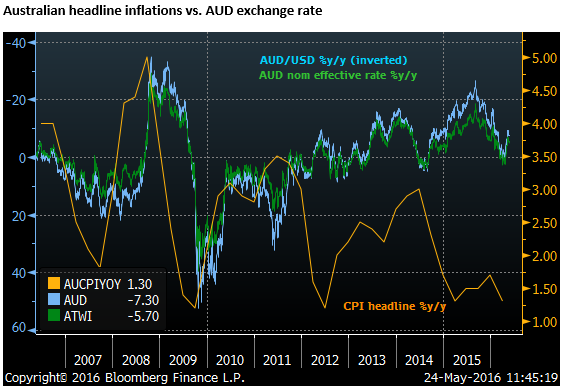
Australian CPI low despite a weaker AUD
Australia has always promoted the flexibility in its exchange rate has providing a buffer for inflationary or deflationary effects of swings in commodity prices. These may be amplified in Australia as a large commodity producer. The AUD was persistently strong ahead of the 2007/08 global financial crisis, and resumed this strength after the crisis in 2010/2012. The RBA has often argued that this helped contain the inflationary impact of a relatively strong economy in the resources boom.
However since 2013, the AUD has been falling persistently, with a peak decline of around 20%y/y around Q3 2015. That decline has flattened out more recently, but the RBA sees the inflationary impact from a weaker exchange rate extending for two or more years past the event and it has been surprised by the lack of pass-through from a weaker exchange rate to higher inflation in recent quarters.
The RBA has mentioned lower wage costs, heightened retail competition as contributing factors to lower than expected inflation.
It also noted that housing related inflation was lower recently, which is the flip-side of higher housing related inflation in 2013 through 2015 as the RBA slashed rates and pumped up the housing market. As such, it was able to hold inflation up in recent years above that in major economies in part by fueling a housing market boom. That boom is fading and now this inflationary impact is waning, also offsetting the inflationary impact of a weaker exchange rate.
The RBA is still looking for inflation to firm late this year from current levels, helped by the earlier depreciation of the AUD, but only sees headline and core inflation back to around the bottom of its 2 to 3% target band towards the end of its three-year horizon.
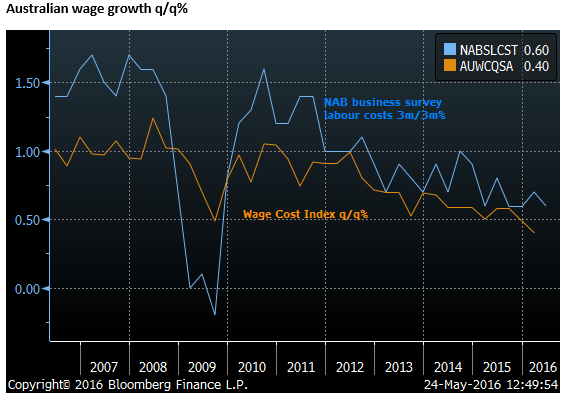
Weak wage growth dragging down Australian inflation
Lower than expected wage growth in Australia has been a significant factor in the downward revision in the RBA’s Australian inflation outlook. This has reflected ongoing slack in the labour market, even though the labour market has tightened significantly over the last year, but also the shift in jobs from higher paying mining construction industry to lower paying non-mining sector jobs.
However the RBA also notes that low wage growth has been evident in a range of advanced economies, suggesting there may be global trends at force, and in part that may be feed-back from lower global inflation expectations reducing worker wage demands.
The chart below shows quarterly wage growth indicators in Australia, illustrating the record low and falling trend in Australian wages.
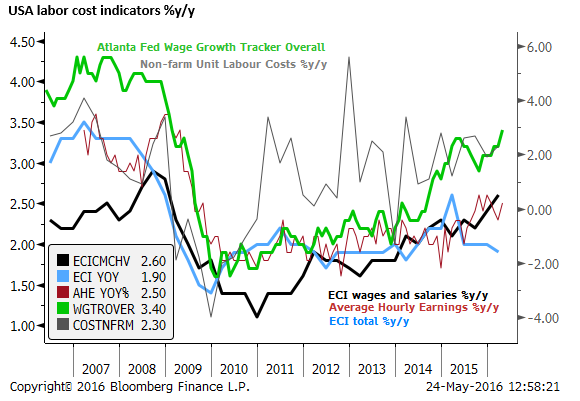
USA wage growth rising
However, while US labor cost growth remains low compared to before the 2008 Global Financial Crisis, recent indicators suggest they are accelerating, perhaps in response to the significant tightening in the labor market in the last year. For instance the Atlanta Fed Wage Growth Tracker has risen to 3.4%y/y in April a high since 2008.
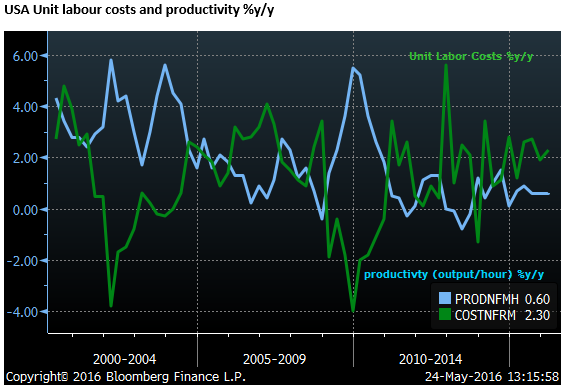
USA unit labour cost growth already above the inflation target
Another fact that may be contributing to higher inflation pressure in the USA is slower productivity growth over the last few years, tending to increase unit labour costs faster for a slower rate of wage growth.
The chart below also shows unit labor costs in the USA up 2.3%y/y in Q1-2016, averaging above this pace for the last year, suggesting that underlying inflationary pressure from the labor market has been above the Fed’s 2% target for some time.
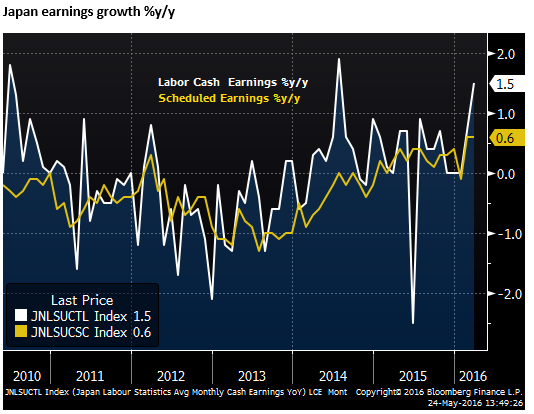
Japan wage growth may have stalled
Japan has achieved some progress in raising wage growth as its labor market has tightened. This might help underpin its inflation outlook. However, labour cost growth remains lower than necessary to generate target inflation.
After years of deflation, wage growth has been largely positive for the last two years. The chart below shows growth in total cash earnings and scheduled (underlying) earnings. Scheduled earnings have risen by 0.6%y/y in Feb and March; long term highs.
The government and BoJ have exerted significant political and moral pressure on companies to lift wage growth with moderate success. That success appears to have waned this year with reports that the latest annual spring wage negotiations have delivered a lower increase than the previous year, suggesting wage growth may stagnate over the year ahead. The stronger JPY this year and weaker export growth are likely to have contributed to lower wage negotiations for the year ahead.
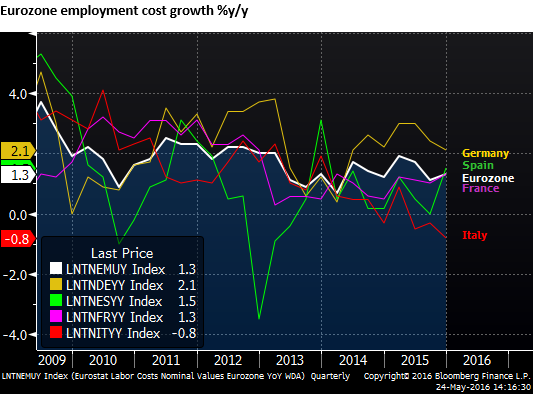
Eurozone wage growth sticky but still declining
Wages growth in the Eurozone has been relatively sticky in recent years despite high unemployment. Nevertheless, the employment cost index for the Eurozone in Q4-2015 was 1.3%y/y, little changed over recent years, and down from around 2.0% in 2011/2012.
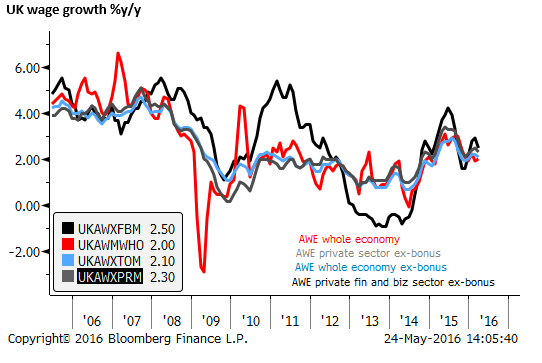
UK wage growth set-back since last year
UK wages growth picked up solidly from late 2014 into 2015 peaking at a reasonably healthy 3.4%y/y growth for core private sector wages, excluding bonus in May-2015. However wage growth has lost moment recently, falling to 2.3%y/y in March 2016.