Weaker CNY inducing more China capital outflow and reinforcing USD strength
The CNY is still one of the least volatile currencies in Asia, but it has become more volatile and is the weakest in Asia this year. Since the beginning of the year, The Chinese government has moved to emphasize management of its exchange rate against a basket of other currencies. Their official basket includes significant components for EUR, JPY, and GBP. As such, even though the CNY has depreciated significantly against the USD, it has been stable against its basket since July. Nevertheless, China did allow the CNY to depreciate steadily against its basket in the first half of the year, and it appears to be pursuing a weaker exchange rate policy. Chinese citizens and company capital outflow has persistent at a moderate pace this year, kept under control by capital flow restrictions. However, in recent months it has picked up to a high since January when adding inflows from onshore to offshore RMB. These flows do not appear be causing severe liquidity problems for Chinese capital markets or wider global risk aversion, but they do point to underlying weakness in Chinese economic confidence and may be contributing to strength in the USD against other currencies.
Chinese currency weakest in Asia this year
The weakness in the CNY is gaining considerable attention and appears to be spilling over to weaker Asian currencies more generally.
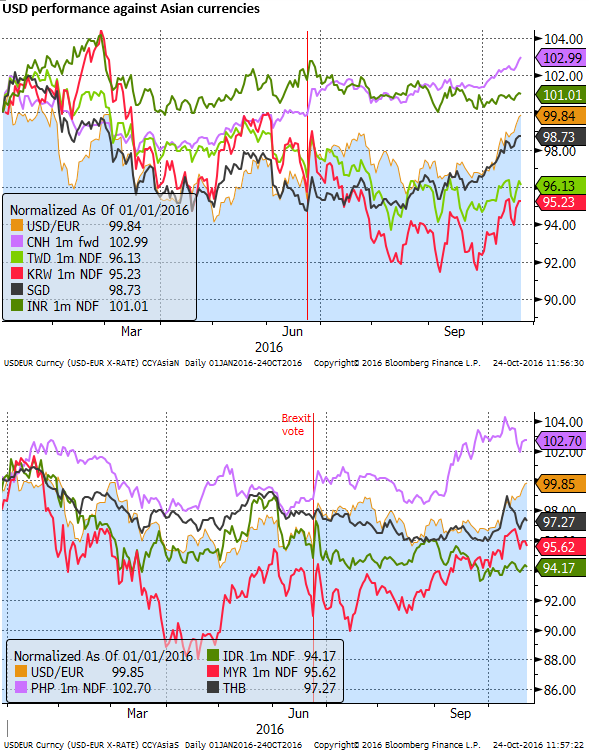
The CNY is still one of the least volatile currencies in Asia, but it has become more volatile over the last year and it is the weakest in Asia this year.
China emphasis now on the basket
The Chinese government has moved to emphasize management of its exchange rate against a basket of other currencies.
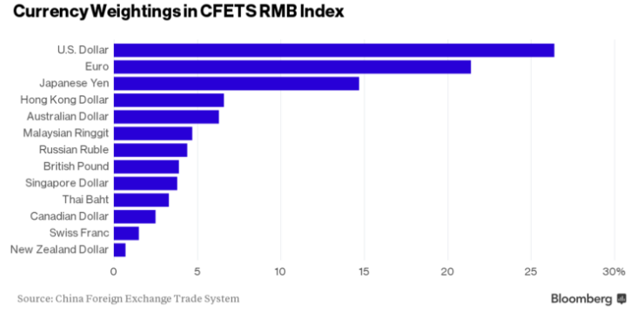
The China Foreign Exchange Trading System, an arm of the PBoC, has been publishing a weekly update of the CFETS RMB index on a weekly basis since December. It is a measure of the CNY against a basket of 13 currencies with weights based mainly on international trade, according to the PBoC.
The weights, shown graphically below, illustrate that the basket is highly influenced by the EUR and JPY. It also includes a 4% weight in GBP. It doesn’t include anything for KRW or TWD, despite the significance of trade with and in competition to Korea and Taiwan, but it includes the THB, MYR, and SGD. The SGD runs its own currency basket, with significant components for major currencies. There are also a number of commodity currencies.
As a result of the significant rise in recent weeks of the USD against other major currencies, (EUR, JPY, and GBP), the currency management approach in China has tended to also result in a significant rise in the USD against the CNY.
In turn, this has spilled over to weakness in its close neighbors’ currencies, KRW and TWD, and some broader weakness in Asian currencies.
There is a degree of self-fulling prophecy here. The increasing importance of CNY for Asia and global markets has contributed to some additional gains in the USD against developed and emerging currencies.
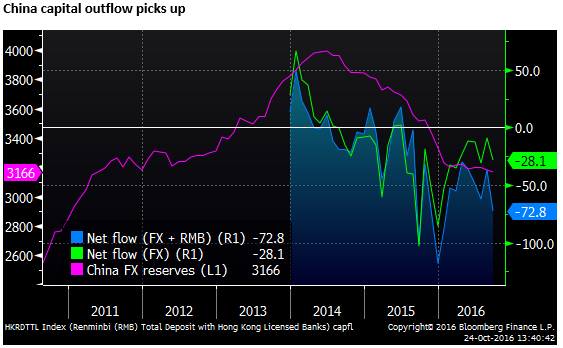
China capital outflow picks up
While the Chinese government may have shifted towards closer management of the CNY against the CFETS basket, its own citizens and companies are mainly seeing the increased volatility and, more recently, a rapid fall in CNY against the USD. This appears to be resulting in a more persistent capital outflow from China.
The chart below shows that the USD value of Chinese FX reserves peaked in 2014. It also shows two estimates of net monthly capital cross-border flow. The Green line is a measure of net foreign exchange sold for RMB. This turned most often to net sales of RMB (outflows) around mid-2014. Outflows rose to peaks in Sep and Dec 2015, as fear of CNY depreciation picked up after the one-off CNY devaluation in August 2015.
FX outflow has persisted this year, although it has been more moderate since April, perhaps contained at times by a weaker USD and Chinese government enforcement of capital controls, limiting outflow.
The blue shaded line shows an alternative estimate of monthly capital outflow. It includes the net FX sold for RMB plus cross-border movement of RMB (mostly movement from onshore RMB to offshore RMB held in Hong Kong).
Adding in these cross-border flows of RMB makes the capital outflow look more significant, picking up recently to a high since January of around US$73bn in September ($US44bn in RMB cross-border flows). The movement of capital in RMB may be a way for Chinese citizens and companies to avoid restrictions that apply to converting RMB to FX onshore.
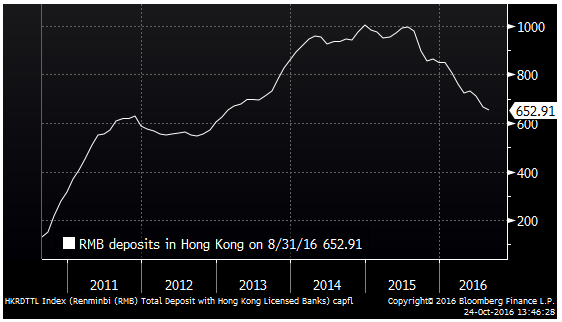
The evidence suggests that once this RMB has been moved offshore (to Hong Kong), it is converted to FX. The chart below shows that even though there has been a sharp increase in RMB movement from onshore to offshore, RMB held on deposit in Hong Kong has declined, suggesting it is mostly converted to FX.
The Chinese government has turned to intervening, not only in the domestic CNY market, but also at times in the offshore CNH market. They have tightened liquidity in Hong Kong pushing up CNH rates in Hong Kong to help reduced selling pressure on CNH. The chart below shows one-year RMB rates in China and Hong Kong.

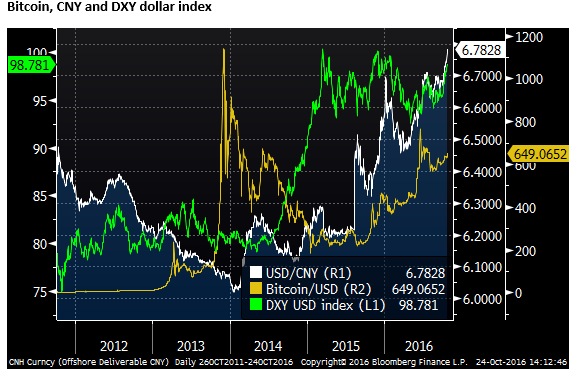
Another avenue some people have discussed as a way Chinese citizens have used to move capital offshore or at least exit exposure to CNY has been to buy Bitcoin. Bitcoin is much more ‘flighty’ and Its correlation with CNY is not obvious, but the value of bitcoin has increased by more than double since the CNY was devalued last year.
The outflow is also apparent at the corporate level with Chinese companies pursuing more offshore acquisitions in what appears to be in part driven by a desire to diversify balance sheet exposure away from the Chinese currency and assets. Bloomberg data estimates Chinese offshore acquisition at an annual record of $217bn this year.
CNY basket stable since July, but down this year
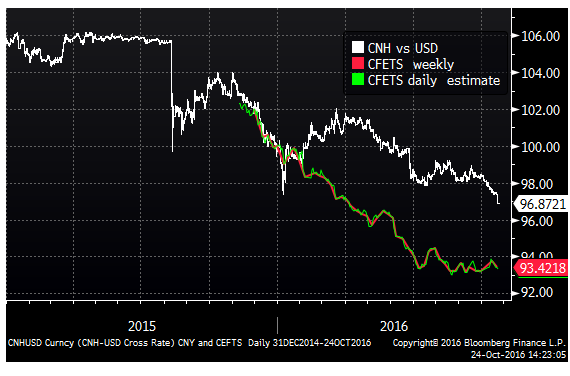
As mentioned the Chinese government has shifted to focusing on managing the CNY against the CFETS basket. The chart below shows the performance of the CNY against this basket and the USD.
It illustrates that while the CNY depreciation has accelerated recently, the CFETS basket has been relatively stable since July.
However, it is also true that through the first half of this year, the Chinese government allowed a steady depreciation of the CNY CFETS basket. This suggests that they have allowed the CNY to weaken to help support economic growth. The CNY CFETS basket is down around 6.6% this year, more than CNY against the USD, down around 3.2%.
Little evidence of panic or fallout
The one-off devaluation in CNY in August last year triggered widespread risk aversion. This flared up again in January. However, there is little evidence of negative fallout from the weaker CNY this year. If anything global asset markets, especially emerging markets, have remained resilient.
USD/CNY FX implied volatility and FX forward points are relatively stable, well below levels at the beginning of the year. Nevertheless, the capital outflow does appear to be persistent and has picked up recently. This may contribute to some tightening of liquidity conditions in China, and it might spill over to weaker demand for US and other government bond markets, via less FX reserves accumulation, somewhat higher global yields and a stronger USD against a broad set of currencies.