RBNZ Communication failure and AUD/NZD fair value
We look at the performance of AUD/NZD relative to commodity prices, the relative interest rate outlook in Australia and New Zealand, and other factors including the search for yield and influence of China. The AUD/NZD looks under-valued with respect to commodity prices and relative interest rates, but this might be explained by the extreme low global yield environment. The under-performance of the AUD may also reflect the weak copper price and under-performing Chinese currency. However, we also look at the mixed and confused messages sent by the RBNZ since its recent Money Policy Statement on 11 August. RBNZ Governor Wheeler has invited the market to bid up the NZD by persisting with his attitude of helplessness and diluting the strong and clear message in his own Monetary Policy Statement.
Wheeler’s communication misses
Following the RBNZ Monetary Policy Statement on 11 August, I wrote RBNZ antes-up in the currency wars, NZD risk to downside. At that meeting the RBNZ cut rates 25bp to 2.00% and projected that it would cut between one and two more times. RBNZ Governor Wheeler in a speech this week confirmed this message saying, “The MPS projected, 35 basis points of further OCR cuts from the current level of 2.00%”.
But just as it did when the MPS was released on 11 August, the NZD rallied yesterday after Wheeler’s speech, despite the acknowledgement that rates have further to fall. The market clearly is unimpressed with the prospect of one or two more rate cuts that would take rates down to 1.5 to 1.75%. In the current low yield environment that would still be a relatively attractive yield.
What made me see downside risk in the NZD after the 11 August MPS (I concluded that “We may finally be near the juncture where AUD/NZD is ready to make its much anticipated recovery”) was not this base-line forecast, it was an alternative scenario in the MPS that said that if the NZD trade-weighted index remained steady, and did not fall across the forecast horizon, the RBNZ would cut rates more than 100bp to a low near 0.75%, considerably more than the base-line forecast.
I wrote that, “This is one of the most dovish rate scenarios that the RBNZ has ever projected, offering a path for rates that is highly dependent on the exchange rate and is far below its base-line forecast.”
Apart from making an explicit connection between its cash rate projections and the exchange rate, the MPS said, “a decline in the exchange rate is needed”, much more emphatic than the RBA’s “an appreciating exchange rate could complicate” the rebalancing in the economy.
I concluded that, “It does not appear that the RBA will respond quickly to an appreciating currency. The RBNZ is readying another cut and may keep going towards year end and into 2017 if the exchange rate does not fall.”
However, since this MPS, AUD/NZD has fallen steadily from near 1.07 to the low 1.04s. And the NZD TWI has also risen by around 1 to 2%. So what has gone wrong for the RBNZ and its desire for a lower NZD?
First of all is the messaging from RBNZ Governor Wheeler; both at his press conference after the MPS and in his speech on Tuesday. The media headlines from Wheeler’s speech on 23 August were “Wheeler says no need for Rapid Interest-Rate Cuts.” This feeds straight into the bullish argument for NZD, suggesting that RBNZ rate cuts are not expected to seriously change the high yield status of the NZD.
It did not help either that Assistant Governor McDermott said in the days after the MPS that the Bank prefers to change policy at the quarterly MPS dates, suggesting that it was unlikely to cut at the next policy review date on 22 Sep, and was likely to hold rates steady until 10 November. And seemingly wiping out half of the opportunities to cut rates over the year ahead.
Wheeler and to some extent McDermott have effectively diluted a clear message in the MPS that appeared to raise the stakes in an effort to combat the disinflationary consequences of the stubbornly high exchange rate.
Since taking the helm some years ago Wheeler has exuded a sense of helplessness to make a difference in his institution’s efforts to achieve its policy goals. His most recent outings at the MPS press conference and his speech this week have reached a new low in effective communication. The MPS was a well-structured firmly argued call to arms that was essentially flushed down the toilet by the Governor that appeared to lack any conviction or commitment.
The Governor of the RBNZ has the final say on policy. He is not beholden to a committee or policy board. So if any central banker should stand behind his institution’s policy statement, he should. By straying off-message, failing to emphasize the key reaction function and phrases in that report, Wheeler suggests that it is a document that serves little purpose. He appears un-motivated and the RBNZ sluggish and reactionary. I can only imagine the frustration that some of the staff feel that contributed to the MPS.
On several occasions, including the most recent MPS press briefing, Wheeler has quoted BIS statistics on the daily volume of FX markets to illustrate the futility of FX intervention in response to press questions. This is an example of how Wheeler voluntarily waves a white-flag to the market. Why? Is it because he is just intellectually honest and can’t help espousing his random views when asked a question? Surely a man in his position has learned the basic skill of re-framing a question to provide an answer that is on message. Was this not an ideal opportunity to quote his MPS that the exchange rate “needs to fall”, that we are prepared to cut much deeper if it does not, intervention is always an option that we can use if we think it will be effective?
Wheeler’s speech this week opened with, “I will draw heavily on and emphasize the messaging contained in the recently released August Monetary Policy Statement”. More accurately, he should have said I will not directly contradict anything that was in that report, but will leave out the message that we are more focused on combating the disinflationary consequences of a strong exchange rate.
The speech was littered with and led out with the Wheeler trademark focus on why he is constrained from achieving his goals, perpetuating his image of helplessness.
He said, “But several factors constrain the influence of central banks, particularly in small open economies. Long term interest rates are set by global saving and investment flows, country risk premia and expectations for economic growth and inflation. Central banks only have limited control over tradables inflation. For example, they have no influence on the global oversupply of commodities, manufactured goods and capital goods, or on overseas inflation rates.”
“Central banks generally have limited control over the exchange rate. For example, the Reserve Bank has lowered the OCR six times since June 2015 and the TWI remains some 2½ percent higher than it was at the commencement of cutting. Central banks cannot persistently achieve a lower nominal exchange rate unless monetary policy is fully dedicated to that goal (and even then cannot permanently achieve a lower real exchange rate). They might influence financial risk taking through short term interest rates, but other factors, such as regulation and taxation, will determine whether this flows through into investments that enhance productivity and real income growth. In addition, the scope that central banks have to influence short-run activity and wage and price setting behavior diminishes as interest rates approach zero, and the limits for quantitative easing are reached.”
If the audience was still awake, they may have wondered…what is the message? I am powerless and my job is a waste of time?
Wheeler again quoted his favorite BIS FX turnover stats in this speech for umpteenth time. He said, “According to the last BIS triannual survey, the New Zealand dollar is the 10th most traded currency in the world with the 2013 data showing average daily turnover of USD105 billion, roughly equivalent to 65 percent of New Zealand’s GDP. If financial markets believe that the Bank has abandoned its inflation objectives and is seeking to maintain policy rates at a level consistent with below-target inflation, they will conclude that the easing process is over and proceed to bid the exchange rate up, perhaps substantially so.”
I am not even sure what relevance quoting this statistic has in this paragraph. Most of the time he uses this statistics to explain why it is pointless to intervene, but he seems to be using it here as a reason to cut rates to prevent the currency from going up more. He might pull this statistic out at parties to support his notion that Pinot Gris is better with Salmon that Sauvignon Blanc. It would make as much sense.
I am going to call-out Wheeler on this statistic. FX turnover is 90% pass the parcel, so the same basic deal is counted over and over again. 90% is short term bish-bash by high volume traders that are buying and selling through-out the day with minimal net impact on the price. The market is a herd of beasts that will follow the trend, the trick is not to stand in front of the herd and wave a flag, but stand with a whip and turn the few leaders.
Granted intervention and jawboning have limitations, but when they are linked to a clear and consistent policy agenda, such as we are prepared to cut rates to offset possible further gains in the exchange rate and use macroprudential measures to control excesses in the housing market, then as a central banker you are not powerless to influence the exchange rate. The NZD might not reverse course dramatically, but I would argue that Wheeler has contributed to the strength in the currency via his poor communication and failure to understand his capacity as Governor to provide better guidance to the market. There is a wide range of uncertainty over what the fair value of an exchange rate is, the RBNZ has the capacity to move the currency within that range to the side which best suits its policy objective by employing the subtle art of better communication.
The message from Wheeler and McDermott since 11 August MPS is that we are not fully committed to the strategy set-out in the MPS. We do not really think we have any capacity to prevent the market doing whatever it likes with the currency. We are reluctant to cut rates more aggressively even though we said we are prepared to in the MPS. We don’t have much faith in our macroprudential measures to influence the housing market. We are reluctant to push these policies harder. And when we miss our inflation target for the eighth, ninth and tenth years it will be because we had no control over global factors.
This may not have been the message they intended to send. But if they want to change that, they need to speak much less about what they can’t do and speak a lot more about what they are prepared to do.
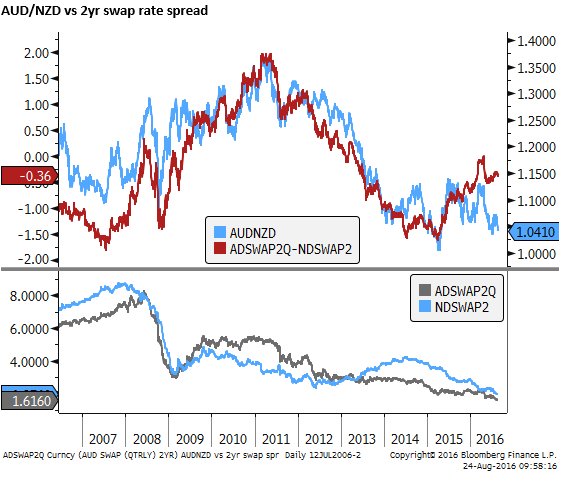
AUD/NZD appears expensive relative to its interest rate spread
The AUD/NZD has been one of the more closely aligned pairs to its relative interest rate outlook. The chart below compares it to the spread in 2yr swap rates. The chart shows that over the last decade, the AUD/NZD is near its record lows, under-performing the rate spread by the largest margin over this period. The 2yr rate spread is not far below its average of this period and is a relatively narrow 36bp in favor of the NZD. Based on this comparison gives us the first hint that the NZD is relatively expensive.
AUD/NZD and commodity prices
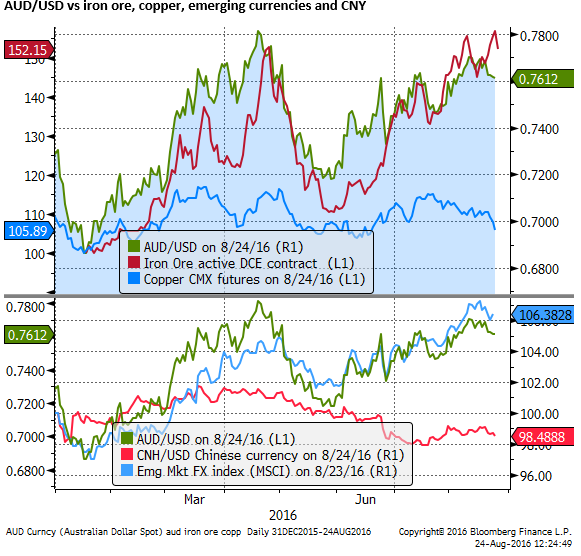
AUD and NZD are both commodity currencies and thus frequently move together in line with global growth indicators, but they have very different key commodity exports. New Zealand is mainly an agricultural exporter, dominated by dairy. Australia is predominated an exporter of iron ore, coal and gas. So differences in their key commodity exports may account for some of the difference in currency performance.
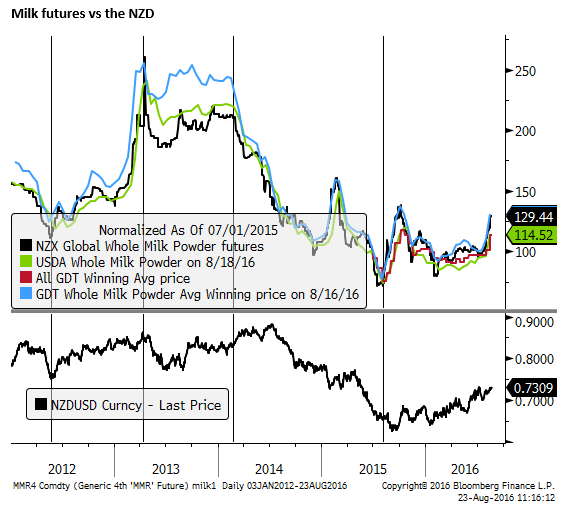
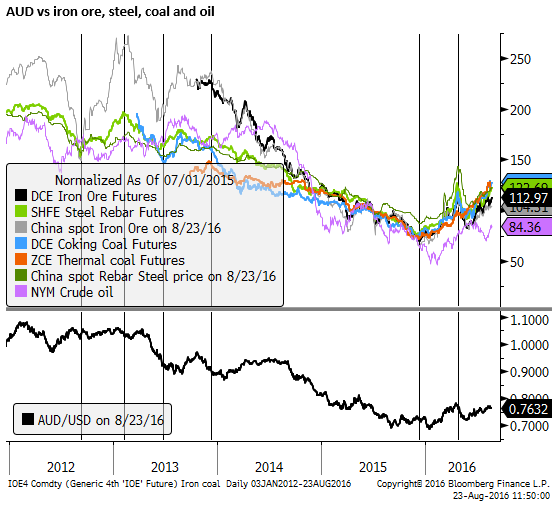
Milk prices have been depressed in recent years, but have recovered significantly in recent weeks. Perhaps this might help explain the fall in AUD/NZD since the 11 August MPS. But on the other hand iron ore, coal and oil prices (a proxy for gas) have improved significantly throughout the year. So overall, it is still not a good argument for near record lows in AUD/NZD.
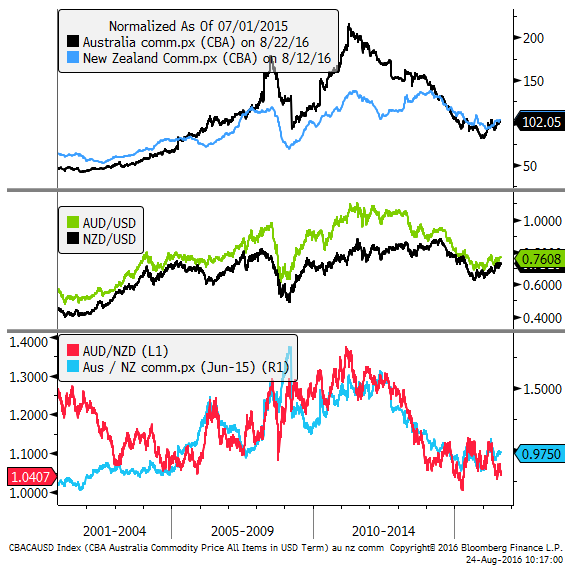
The following two charts compare the NZD/USD and AUD/NZD to their most closely followed and relevant indicators of commodity export prices.
The third chart below compares the AUD/NZD to the relative performance of iron ore and milk. Over the last six years the relative performance of these two key commodities has broadly done a pretty good job of explaining the AUD/NZD exchange rate.

Exploring this theme further we use the CBA commodity price indices for Australia and New Zealand over a longer period. Again we find relative commodity price trends have been a pretty good explainer of the AUD/NZD since 2001.
Focusing on the third panel in the chart, the bigger rise in Australian commodity prices through to 2012, helped explain the rise in AUD/NZD to the 1.30s. The subsequent reversal in this trend might account for much of the fall in AUD/NZD.
A model of AUD based on commodities and rate spreads
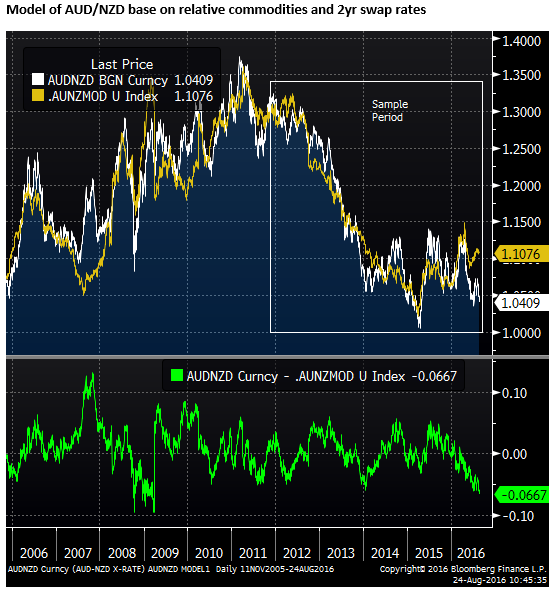
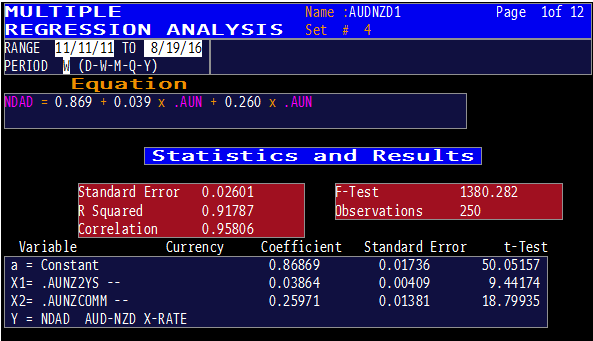
Exploring this analysis further we have used the multiple regression function on Bloomberg to generate a simple model for the AUD/NZD based on two explanatory variables, the 2yr swap rate spread and the relative Australian and New Zealand commodity price index. Apologies to statistical purists, I have used levels mainly so I can easily chart the model outcome in Bloomberg. The chart below illustrates the outcome using the last 250 weekly observations.
The results suggest that the fair-value for AUD/NZD is around 1.1075, and the current level of AUD/NZD in the low 1.04s is over 2.5 standard errors below, the widest margin over the sample period.
The Reach for yield
Now I won’t be so mean as to blame this degree of over-valuation in the NZD on Wheeler’s communication issues, a contributing factor may be an excessive reach for yield. In the current low global yield environment the seemingly meager 30bp odd difference in the AUD/NZD 2yr swap rate spread perhaps packs a bigger punch than in past years.
To incorporate this idea into the model we could add in the JP Morgan aggregate global yield index that is around record lows. If we do this over the same 250 weekly observations it adds little to the model and suggests there is no relevance for AUD/NZD fair-value.
However, this has probably been a more recent influence in the extreme low yield environment generated by NIRP/QE polices, so we ran the multiple regression analysis over the last 250 daily observations. Over this more recent sample period, the level of global yields appears to have taken on a more important influence than commodity prices or the 2yr swap rate spread in explaining the AUD/NZD.
The chart below illustrates the outcome of this model (compared to the earlier one). It suggests that fair-value for the AUD/NZD may be 1.055, and the current level of the currency pair in the low 1.04s is 1.2 standard deviations below.
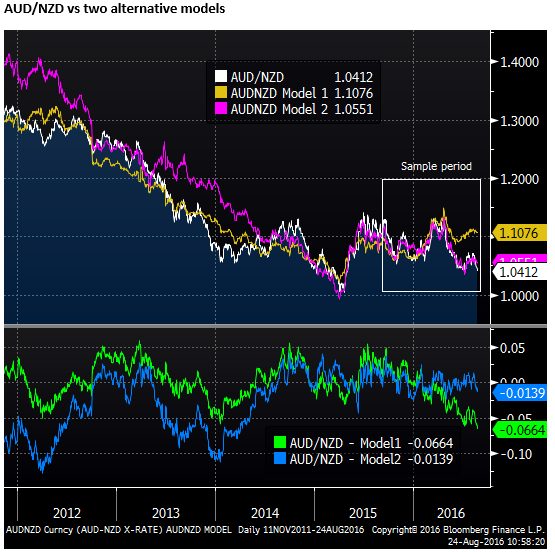

We might conclude that the NZD is not seriously out of line with current drivers of the currency, with low global yields a key factor pushing up the NZD more so than the AUD.
However, with 30bp of difference in yield between AUD and NZD, the RBNZ could probably make a difference if it did more to highlight other factors such as its firmer stance on the exchange rate “needing to fall”, tougher macroprudential regime that it is actively working on expanding to income limits on debt to income ratios. A willingness and indeed a plan to cut rates further to combat the higher NZD.
China and Copper feedback to AUD
An additional factor weighing on AUD/NZD may be the greater liquidity in AUD and AUD financial products. At times this may work against the NZD, as investors turn more naturally to the AUD as an investment vehicle. However, the AUD has also served as a liquid proxy for concerns over China. Both Australia and New Zealand count China as key to their trading performance. And both have experienced increased capital flow to their property markets from China. However, Australia has been more highly and directly linked to industrial activity in China. It is more closely aligned to the riskier side of China’s growth – its real estate and fixed asset investment activity. As such, the AUD may move more than NZD with respect to sentiment in China’s financial and industrial sectors, reflecting its more direct association and more liquid capital markets.
More recently financial and economic risks related to China appear to have eased. As such, it is not clear that this should have undermined AUD/NZD this year. However, the CNY has significantly under-performed other Asian currencies. And while iron ore prices have recovered significantly this year, there may be some doubt over the sustainability of this rebound. Copper prices have diverged from iron ore prices this year and may provide an alternative read on the strength of industrial metal demand in China.
Copper has led a fall in industrial metals in recent days an observers have highlighted that Chinese copper imports fell sharply in July and LME copper inventories to a high since November.